Lamyaa Kadhim Ouda
Author’s affiliations:
Lamyaa Kadhim Ouda, 1st Department of Pathological Analysis / College of Science / Thi -Qar University, Iraq; Email: lamyaa.kadhim@sci.utq.edu.iq; ORCID ID : https://orcid.org/0009-0005-1636-947
Correspondence: Lamyaa Kadhim Ouda, Email: lamyaa.kadhim@sci.utq.edu.iq
Background: Confidence in medical care is crucial for treatment adherence and well-being in cancer patients. While prior research has explored demographic and clinical predictors, the relative influence of objective clinical factors on subjective patient experiences (e.g., symptom burden and health perceptions) remains unexplored.
Objective: This study was conducted to evaluate whether demographic and clinical factors (age and cancer stage) or patient-reported experiences (symptom burden, health perceptions, and monitoring beliefs) can predict patients’ confidence in medical care.
Methodology: It was a cross-sectional survey conducted on 300 adult cancer patients, suffering from breast, leukemia, lung, or prostate cancer, at a tertiary-care oncology center in Iraq. The participants completed a 14-item questionnaire, which was designed to assess the symptom burden, health perceptions, support, monitoring beliefs, and confidence of the patients. Statistical analyses included Pearson’s correlations and hierarchical multiple regression.
Results: This study of 300 adult cancer patients (mean age 53.39 ± 20.86 years; 66% female) found demographic/clinical factors (age, cancer stage, gender, cancer type) had negligible or minimal, non-significant correlations with confidence in medical care. In contrast, patient-reported factors showed strong positive correlations: perceived quality of life (r = 0.743) and belief in test-based monitoring (r = 0.686) significantly predicted higher confidence, with weak inverse correlations for symptom interference and fatigue (r ≈ -0.10). Hierarchical regression confirmed that demographics explained almost no variance (R² = 0.003), while adding patient-reported factors (especially QoL and monitoring beliefs) significantly improved the model, explaining 58.3% of the confidence variance (ΔR²=0.58, P < 0.001).
Conclusion: Confidence in healthcare among cancer patients is predominantly driven by subjective illness experiences, specifically perceived quality of life and belief in monitoring efficacy, rather than demographic or clinical severity. Interventions targeting symptom management, clear communication regarding test-based monitoring, and reinforcement of self-efficacy are recommended to bolster trust of the patients.
Keywords: Cancer patient confidence, Quality of life, Monitoring beliefs, Symptom burden, Patient trust.
Citation: Ouda LK. Clinical and psychological predictors of confidence in healthcare among cancer patients.Anaesth. pain intensive care 2025;29(8):946-954. DOI: 10.35975/apic.v29i8.3022
Received: July 23, 2025; Revised: August 22, 2025; Accepted: August 22, 2025
1. INTRODUCTION
Confidence or trust in medical care is the cornerstone of high-quality oncology practice.1 Patients who report greater confidence in their physicians are more likely to adhere to treatment recommendations, engage openly in clinical decision-making, and experience less emotional distress during therapy.2 Trust also facilitates effective patient–clinician communication, which has been shown to improve satisfaction, reduce fear, and support shared decision making across the cancer continuum. 3 A growing body of work has sought to identify the factors that most strongly shape cancer patients’ confidence in their care. Structural and demographic characteristics, such as age, sex, and cancer stage have shown inconsistent associations with patient experience; some registry analyses find no relationship between these variables and trust, while others report modest disparities by race and socioeconomic status.4 In particular, racial differences in physician–patient communication account for lower trust among Black patients with lung cancer, even when clinical indicators are similar.5
Beyond demographics and care processes, symptom burden and patients’ illness representation are emerging as critical determinants of confidence. Higher levels of pain, fatigue, and functional interference predict more threatening illness perceptions and poorer quality of life (QoL) in cancer survivors, while social determinants such as income and social isolation further exacerbate symptom distress.6,7 The Common-Sense Model of self-regulation posits that these subjective experiences guide patients’ cognitive and emotional responses to illness, shaping how much they believe in their clinicians’ ability to control disease progression.8
Despite these insights, no study to date has simultaneously examined objective clinical factors, patient-reported symptoms, and belief measures in predicting cancer patients’ confidence in care. Prior research has largely focused on communication interventions (e.g., empathy training and shared decision-making tools) or on single-domain predictors such as physician competence or demographic disparities among rare cancer groups9. A comprehensive model that integrates both “hard” clinical indicators and “soft” self-reported experiences is lacking.
Accordingly, the present study evaluated how age, cancer stage, symptom burden, illness perceptions, and beliefs about monitoring jointly predicted patients’ confidence in their medical care. By elucidating the relative contributions of these domains, we aim to inform tailored interventions that strengthen trust and ultimately optimize clinical outcomes for people living with cancer.
We conducted a cross-sectional survey between January and June 2022 at the Oncology Clinic of Basrah Oncology Center, a tertiary care facility serving a heterogeneous cancer population. The study was approved by the Basrah Oncology Center and all participants provided written informed consent prior to enrollment.
A priori power analysis (G*Power 3.1) indicated that to detect a small effect (f² = 0.05) with α = .05, power = .80, in a regression with up to 10 predictors, a minimum sample of 262 was required. Thus, our final sample of 300 provided adequate power to detect small‐to‐medium effects.
A total of 300 adult patients (aged 18–89 years), with a confirmed diagnosis of cancer of the four specified types, and receiving cancer treatment within the previous 12 months, were consecutively recruited during routine outpatient visits. Patients were excluded if they had cognitive impairment, severe psychiatric disorders, or sensory limitations preventing questionnaire completion.
Basic demographic (age, gender) and clinical (cancer type; breast; leukemia; lung or prostate); stage at diagnosis, 1 through 5, corresponding to standard TNM-derived stages information was abstracted from medical record.
2.1. Measures
The study employed a structured, self-administered 5-point Likert scale questionnaire adapted from two internationally validated instruments: The European Organization for Research and Treatment of Cancer Quality of Life Questionnaire (EORTC QLQ-C30) 22 for assessing symptoms and quality of life, and the Trust in Physician Scale for evaluating patients’ trust in their physicians. Both tools have been extensively utilized in oncology research across diverse populations, ensuring their global applicability. Cultural adaptation followed standardized procedures including forward–backward translation, expert panel review, and pilot testing with 20 cancer patients to ensure contextual relevance. A standardized administration protocol was implemented to enhance reproducibility.
The adapted questionnaire demonstrated strong content validity (Content Validity Index, CVI = 0.89) and high internal consistency (Cronbach’s α = 0.82), consistent with previous validation studies.
2.2. Procedure
Eligible patients were approached by a research coordinator during scheduled clinic visits. After consenting, participants completed the paper‐and‐pencil survey in a private consultation room; the completion required approximately 15 minutes. The survey responses were de-identified and entered into a secure REDCap database. A 5% random audit of the data entries yielded >99% accuracy.
2.3. Statistical analysis
All analyses were conducted using IBM SPSS v.26. Prior to hypothesis testing, data were screened for missing values (listwise deletion applied for any record with missing values on core variables, yielding N = 300 complete cases), univariate outliers (z > ±3.29), and normality (skewness/kurtosis within ±1.0 for key variables).10
Means, standard deviations, and ranges were computed for demographic and clinical variables, as well as for each self-report item. Pearson correlation coefficients (two-tailed) were calculated for age, sex (dummy‐coded), cancer type, stage at diagnosis, and all 14 self‐report items. Significance was evaluated at α = .05, P < .05, and P < .01.
To identify the predictors of patient confidence in medical care, we used a hierarchical multiple regression model. In Step 1, demographic (age, gender) and clinical (cancer type, stage) variables were entered; in Step 2, self‐report domains (e.g., symptom interference, overall health perception, test beliefs, and quality of life) were added. Model assumptions—linearity, homoscedasticity, multicollinearity (VIF < 2.0), independence of errors (Durbin–Watson ≈ 2), and normality of residuals—were verified using diagnostic plots and statistics. Model fit was assessed using R, R², and adjusted R²; predictor contributions were evaluated using standardized β coefficients, t-tests, and associated P-values.
3. RESULTS
Table 1 summarizes the demographic and clinical characteristics of the study participants (N = 300). The participants had a mean age of (53.39 ± 20.86), ranging from 18 to 89 years. The sex distribution was 198 (66.0%) female, 84(28.0%) male and 18 (6.0%) not to specify. The cancer types included breast150 (50.0%)65(22.0%), leukemia 45(15.0%,) and prostate cancer 40 (13.0%) (Figure 1). Stages at diagnosis were distributed as shown in Table 1.
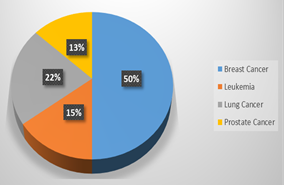
Figure 1: Distribution of diagnosed cancer types among participants.
Baseline demographic and clinical characteristics of the study population (N = 300) presented frequency distributions of self-reported health measures across 14 domains using a 5-point Likert scale (1 = Strongly Disagree to 5 = Strongly Agree). There was high endorsement of familial/social support, awareness of blood test significance, belief in test-based disease tracking, and trust in medical care.
Regarding moderate-to-high symptom burden, 58% reported daily cancer-related pain, 55% reported symptom interference in daily activities, and 60% experienced frequent fatigue. Negative health perception was expressed by only 22%; rated overall health as excellent (53% disagreed), while 41% perceived rapid health decline, and 52% reported health-related distress. Gaps in supportive care were evidenced by 42% disagreeing about the receipt of nutritional counseling at diagnosis. QoL perceptions were mixed (39% were positive, 27% were negative, and 34% were neutral). Responses clustered near the scale midpoint, indicating variability in subjective experiences, despite homogeneous clinical demographics.
As shown in Table 3, the Pearson correlations examining relationships between demographic/clinical variables (age, gender, cancer type, stage) and patient-reported symptom/health perception measures revealed minimal associations for objective factors: age demonstrated negligible, non-significant correlations with all symptom/health variables (|r| ≤ 0.081, all p> 0.16), and cancer stage (|r| ≤ 0.077, all p>0.18). Minor exceptions included a weak inverse correlation between sex (women) and poorer self-rated health (r = −0.115, P = 0.047) and a modest positive correlation between cancer type and health-related distress (r = 0.175, P = 0.002).
Conversely, strong and significant intercorrelations emerged within the symptom cluster, notably between pain intensity and functional impairment (r = 0.477, p<0.01) and between functional impairment and fatigue (r = 0.901, p< .01). Higher symptom burden was consistently correlated with negative health perceptions, including perceived health decline (e.g., pain: r = 0.328, p<0.01) and distress (e.g., fatigue vs. anxiety: r = 0.232, p<0.01). Poor self-rated health was also weakly correlated with higher symptom interference (r = −0.100, P < 0.01) and fatigue (r = −0.084, P < 0.05). Collectively, these findings indicate that objective demographic and clinical factors (age and stage) are largely unrelated to subjective experiences, whereas symptom burden forms a highly coherent cluster that is strongly predictive of adverse health perceptions.
As shown in Table 4, correlational analyses examined the relationships among patient-reported support, health behaviors, treatment information, and confidence in care. Critically, most support and information variables (e.g., familial support and treatment literacy) exhibited non-significant trivial correlations with confidence in care (absolute r ≤ 0.085, all P > 0.14). Key exceptions were a significant negative correlation between receiving nutritional counseling and dietary adherence (r = −0.163, P = 0.005), indicating that advice receipt did not equate to behavioral change, and a positive correlation between awareness of blood test significance and belief in disease-tracking utility (r = 0.166, P = 0.004).
Dominant predictors emerged as perceived QoL, demonstrating strong positive correlations with both beliefs in test-based monitoring (r = 0.743, P < 0.001) and confidence in care (r = 0.686, P < 0.001); no other variable approached this association magnitude with confidence (absolute r < 0.10). Factors such as social support, dietary adherence, treatment information, and side-effect explanations showed no meaningful link to confidence (absolute r ≤ 0.085, P*0 > 0.12). Consequently, confidence in care was overwhelmingly driven by patients’ perceived QoL and belief in monitoring efficacy, overshadowing traditional support and information metrics.
Hierarchical multiple regression analysis revealed that neither patient age nor cancer stage at diagnosis significantly predicted their confidence in medical care. The model incorporating both predictors (age and stage) accounted for a negligible proportion of the variance in confidence scores (R² = 0.003) and was statistically non-significant (F (2, 297) = 0.401, P = 0.670). Standardized coefficients confirmed minimal and non-significant effects of age (β = 0.008, P = 0.895) and cancer stage (β = 0.051, P = 0.377). These results indicate that objective demographic and disease-severity factors do not meaningfully influence cancer patients' confidence in their healthcare.
The distribution of standardized residuals from the regression predicting confidence in medical care was approximately normal and centered on zero (mean ≈ 0, D ≈ 1), with most residuals falling between –2 and +2. There was no pronounced skewness or extreme outliers, as shown in Figure 2.
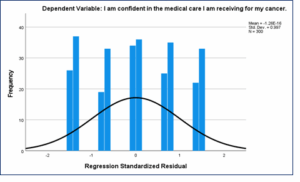
Figure 2: Histogram of standardized regression residuals for the patient confidence model
4. DISCUSSION
The present study examined the demographic, clinical, and patient-reported factors influencing cancer patients’ confidence in the medical care they received. In brief, neither age nor stage of cancer at diagnosis predicted confidence, and the traditional information provision and social support items were largely unrelated to trust in care. Instead, the patients’ self-assessed quality-of-life and belief in test-based monitoring were the strongest correlates of confidence.
The finding that demographic and disease severity factors do not meaningfully shape patient confidence aligns with a study by Suhonen, et al. who found that cancer patients' age, gender, and level of education were not related to their assessments of care quality attributes, such as person-centered care quality, individuality in care, and trust in nurses.11 Similarly, a study by Khullar, et al. indicates that patient trust in clinicians is primarily influenced by aspects of care, such as satisfaction with explanations, overall satisfaction with the provider, and understanding of medical conditions, rather than patient characteristics, such as age or illness stage.12 The study found that these factors accounted for a significant portion of the variance in patient trust, emphasizing the importance of clinician-patient interactions in fostering trust rather than demographic or clinical factors. In contrast, inequalities in cancer care experiences by age and gender have been documented in national patient-experience surveys, with younger and female patients sometimes reporting poorer ratings of care; the study did not replicate those disparities, perhaps reflecting differences in measurement or setting. Crucially, patient-centered communication has repeatedly emerged as a key driver of trust and satisfaction in oncology; newly diagnosed patients who perceive their clinicians as empathetic and informative report higher trust irrespective of clinical factors. Moreover, broader oncology satisfaction studies emphasize that expectations and treatment engagement, more than objective clinical markers, underlie patients’ overall ratings of care,13,14
The correlations suggest that patients’ confidence rests on their subjective appraisal of illness control and well-being, rather than on external characteristics. This align with work of Ugur, et al. and Rajapakse that showed that symptom burden shapes patients’ illness perceptions and coping modes: among early-stage lung cancer survivors, higher symptom distress predicted more threatening illness representations and greater cancer-related worry, which in turn undermined confidence in treatment plans.15,16 Likewise, in adolescent and young adult cancer cohorts, symptom severity has been linked to psychological distress and lower perceived agency in care decisions.17 From a theoretical standpoint, these patterns accord with the Common-Sense Model frameworks of self-regulation, wherein symptom experiences drive cognitive and emotional representations of illness that guide coping and trust in one’s health team.18 Biologically, uncontrolled symptoms perpetuate stress-response activation, dysregulating HPA axis function and heightening fatigue and anxiety, which further erodes perceived self-efficacy.19 Over time, this feedback loop can lead patients to question the adequacy of their medical management when their lived symptom reality diverges from the expectations of control.
The present findings underscore that bolstering patients’ confidence in care may depend more on enhancing symptom management and reinforcing their sense of agency than on demographic tailoring. Clinicians should prioritize routine, systematic assessment of symptom burden using validated PRO tools and respond promptly with tailored interventions (e.g., pain management, fatigue mitigation, psychosocial support). Integrating patient-centered communication training into oncology practice can strengthen patients’ illness representations and align expectations with treatment goals20. Educating patients on how laboratory markers reflect disease status may also reinforce confidence since belief in test-based monitoring was a key correlate of trust in sample. Finally, embedding self-management support (e.g., fatigue self-care strategies and cognitive coping techniques) can interrupt the symptom-stress cycle and preserve patient confidence in clinicians’ expertise.
5. Strengths & Limitations
The strengths of this study include its large, heterogeneous sample (N = 300), comprehensive assessment of both objective (age, stage) and subjective (symptoms, beliefs) factors, and rigorous evaluation of statistical assumptions. However, its cross-sectional design precludes causal inferences; while symptom burden and illness beliefs are linked to confidence, the directionality of these relationships remains to be confirmed. Self-reported measures may introduce response biases, and sample drawn from a single cancer center may not be generalizable to other cultural or healthcare settings. Future longitudinal and interventional studies should clarify whether targeting symptom control and illness perceptions can causally enhance patient confidence, and ultimately, treatment adherence and outcomes. In addition, future research should integrate qualitative methods to explore the relationship between patients’ subjective experiences and trust in healthcare, with attention to cultural and contextual variations in quality of life perceptions
6. CONCLUSION
In this large sample of cancer patients, neither demographic factors nor disease stage predicted confidence in medical care; instead, patients’ perceptions of their QoL and belief in the value of test-based monitoring were most closely linked to trust. These findings suggest that efforts to enhance patient confidence should focus on comprehensive symptom management, clear explanations of monitoring strategies, and reinforcement of patients’ self-efficacy. Future longitudinal studies are needed to test whether interventions targeting these subjective experiences can strengthen trust and improve adherence in oncology settings.
13. REFERENCES
Author’s affiliations:
Lamyaa Kadhim Ouda, 1st Department of Pathological Analysis / College of Science / Thi -Qar University, Iraq; Email: lamyaa.kadhim@sci.utq.edu.iq; ORCID ID : https://orcid.org/0009-0005-1636-947
Correspondence: Lamyaa Kadhim Ouda, Email: lamyaa.kadhim@sci.utq.edu.iq
ABSTRACT
Background: Confidence in medical care is crucial for treatment adherence and well-being in cancer patients. While prior research has explored demographic and clinical predictors, the relative influence of objective clinical factors on subjective patient experiences (e.g., symptom burden and health perceptions) remains unexplored.
Objective: This study was conducted to evaluate whether demographic and clinical factors (age and cancer stage) or patient-reported experiences (symptom burden, health perceptions, and monitoring beliefs) can predict patients’ confidence in medical care.
Methodology: It was a cross-sectional survey conducted on 300 adult cancer patients, suffering from breast, leukemia, lung, or prostate cancer, at a tertiary-care oncology center in Iraq. The participants completed a 14-item questionnaire, which was designed to assess the symptom burden, health perceptions, support, monitoring beliefs, and confidence of the patients. Statistical analyses included Pearson’s correlations and hierarchical multiple regression.
Results: This study of 300 adult cancer patients (mean age 53.39 ± 20.86 years; 66% female) found demographic/clinical factors (age, cancer stage, gender, cancer type) had negligible or minimal, non-significant correlations with confidence in medical care. In contrast, patient-reported factors showed strong positive correlations: perceived quality of life (r = 0.743) and belief in test-based monitoring (r = 0.686) significantly predicted higher confidence, with weak inverse correlations for symptom interference and fatigue (r ≈ -0.10). Hierarchical regression confirmed that demographics explained almost no variance (R² = 0.003), while adding patient-reported factors (especially QoL and monitoring beliefs) significantly improved the model, explaining 58.3% of the confidence variance (ΔR²=0.58, P < 0.001).
Conclusion: Confidence in healthcare among cancer patients is predominantly driven by subjective illness experiences, specifically perceived quality of life and belief in monitoring efficacy, rather than demographic or clinical severity. Interventions targeting symptom management, clear communication regarding test-based monitoring, and reinforcement of self-efficacy are recommended to bolster trust of the patients.
Keywords: Cancer patient confidence, Quality of life, Monitoring beliefs, Symptom burden, Patient trust.
Citation: Ouda LK. Clinical and psychological predictors of confidence in healthcare among cancer patients.Anaesth. pain intensive care 2025;29(8):946-954. DOI: 10.35975/apic.v29i8.3022
Received: July 23, 2025; Revised: August 22, 2025; Accepted: August 22, 2025
1. INTRODUCTION
Confidence or trust in medical care is the cornerstone of high-quality oncology practice.1 Patients who report greater confidence in their physicians are more likely to adhere to treatment recommendations, engage openly in clinical decision-making, and experience less emotional distress during therapy.2 Trust also facilitates effective patient–clinician communication, which has been shown to improve satisfaction, reduce fear, and support shared decision making across the cancer continuum. 3 A growing body of work has sought to identify the factors that most strongly shape cancer patients’ confidence in their care. Structural and demographic characteristics, such as age, sex, and cancer stage have shown inconsistent associations with patient experience; some registry analyses find no relationship between these variables and trust, while others report modest disparities by race and socioeconomic status.4 In particular, racial differences in physician–patient communication account for lower trust among Black patients with lung cancer, even when clinical indicators are similar.5
Beyond demographics and care processes, symptom burden and patients’ illness representation are emerging as critical determinants of confidence. Higher levels of pain, fatigue, and functional interference predict more threatening illness perceptions and poorer quality of life (QoL) in cancer survivors, while social determinants such as income and social isolation further exacerbate symptom distress.6,7 The Common-Sense Model of self-regulation posits that these subjective experiences guide patients’ cognitive and emotional responses to illness, shaping how much they believe in their clinicians’ ability to control disease progression.8
Despite these insights, no study to date has simultaneously examined objective clinical factors, patient-reported symptoms, and belief measures in predicting cancer patients’ confidence in care. Prior research has largely focused on communication interventions (e.g., empathy training and shared decision-making tools) or on single-domain predictors such as physician competence or demographic disparities among rare cancer groups9. A comprehensive model that integrates both “hard” clinical indicators and “soft” self-reported experiences is lacking.
Accordingly, the present study evaluated how age, cancer stage, symptom burden, illness perceptions, and beliefs about monitoring jointly predicted patients’ confidence in their medical care. By elucidating the relative contributions of these domains, we aim to inform tailored interventions that strengthen trust and ultimately optimize clinical outcomes for people living with cancer.
2. METHODOLOGY
We conducted a cross-sectional survey between January and June 2022 at the Oncology Clinic of Basrah Oncology Center, a tertiary care facility serving a heterogeneous cancer population. The study was approved by the Basrah Oncology Center and all participants provided written informed consent prior to enrollment.
A priori power analysis (G*Power 3.1) indicated that to detect a small effect (f² = 0.05) with α = .05, power = .80, in a regression with up to 10 predictors, a minimum sample of 262 was required. Thus, our final sample of 300 provided adequate power to detect small‐to‐medium effects.
A total of 300 adult patients (aged 18–89 years), with a confirmed diagnosis of cancer of the four specified types, and receiving cancer treatment within the previous 12 months, were consecutively recruited during routine outpatient visits. Patients were excluded if they had cognitive impairment, severe psychiatric disorders, or sensory limitations preventing questionnaire completion.
Basic demographic (age, gender) and clinical (cancer type; breast; leukemia; lung or prostate); stage at diagnosis, 1 through 5, corresponding to standard TNM-derived stages information was abstracted from medical record.
2.1. Measures
The study employed a structured, self-administered 5-point Likert scale questionnaire adapted from two internationally validated instruments: The European Organization for Research and Treatment of Cancer Quality of Life Questionnaire (EORTC QLQ-C30) 22 for assessing symptoms and quality of life, and the Trust in Physician Scale for evaluating patients’ trust in their physicians. Both tools have been extensively utilized in oncology research across diverse populations, ensuring their global applicability. Cultural adaptation followed standardized procedures including forward–backward translation, expert panel review, and pilot testing with 20 cancer patients to ensure contextual relevance. A standardized administration protocol was implemented to enhance reproducibility.
The adapted questionnaire demonstrated strong content validity (Content Validity Index, CVI = 0.89) and high internal consistency (Cronbach’s α = 0.82), consistent with previous validation studies.
- Symptom Intensity and Interference
- Pain related to cancer daily
- Symptoms interfere with daily activities
- Fatigue experienced more than three times per week
- Overall Health Perceptions
- 4. Overall, my health is excellent
- My health has deteriorated rapidly over the past month
- I frequently feel anxious or stressed about my health
- 7. I feel supported by family and friends in managing my cancer
- I maintain a balanced diet to help manage my cancer
- Nutritional advice was provided at diagnosis
- I understand the treatment options available for my cancer
- Side effects of treatment have been clearly explained
- I am aware of the significance of blood tests in managing my cancer
- I believe that changes in blood test results can indicate changes in my cancer status
- Patient Efficacy and Trust
- I am able to maintain a good QoL despite my cancer
- I am confident in the medical care I am receiving for my cancer
2.2. Procedure
Eligible patients were approached by a research coordinator during scheduled clinic visits. After consenting, participants completed the paper‐and‐pencil survey in a private consultation room; the completion required approximately 15 minutes. The survey responses were de-identified and entered into a secure REDCap database. A 5% random audit of the data entries yielded >99% accuracy.
2.3. Statistical analysis
All analyses were conducted using IBM SPSS v.26. Prior to hypothesis testing, data were screened for missing values (listwise deletion applied for any record with missing values on core variables, yielding N = 300 complete cases), univariate outliers (z > ±3.29), and normality (skewness/kurtosis within ±1.0 for key variables).10
Means, standard deviations, and ranges were computed for demographic and clinical variables, as well as for each self-report item. Pearson correlation coefficients (two-tailed) were calculated for age, sex (dummy‐coded), cancer type, stage at diagnosis, and all 14 self‐report items. Significance was evaluated at α = .05, P < .05, and P < .01.
To identify the predictors of patient confidence in medical care, we used a hierarchical multiple regression model. In Step 1, demographic (age, gender) and clinical (cancer type, stage) variables were entered; in Step 2, self‐report domains (e.g., symptom interference, overall health perception, test beliefs, and quality of life) were added. Model assumptions—linearity, homoscedasticity, multicollinearity (VIF < 2.0), independence of errors (Durbin–Watson ≈ 2), and normality of residuals—were verified using diagnostic plots and statistics. Model fit was assessed using R, R², and adjusted R²; predictor contributions were evaluated using standardized β coefficients, t-tests, and associated P-values.
3. RESULTS
Table 1 summarizes the demographic and clinical characteristics of the study participants (N = 300). The participants had a mean age of (53.39 ± 20.86), ranging from 18 to 89 years. The sex distribution was 198 (66.0%) female, 84(28.0%) male and 18 (6.0%) not to specify. The cancer types included breast150 (50.0%)65(22.0%), leukemia 45(15.0%,) and prostate cancer 40 (13.0%) (Figure 1). Stages at diagnosis were distributed as shown in Table 1.
| Table1: Descriptive statistics of participant demographics and clinical characteristics | ||
| Variable | Category | n (%) |
| Age (years) | Mean ± SD | 53.39 ± 20.86 |
| Range | 18–89 | |
| Gender | Male | 84 (28.0) |
| Female | 198 (66.0) | |
| Unspecified | 18 (6.0) | |
| Type of Cancer | Breast | 150 (50.0) |
| Leukemia | 45 (15.0) | |
| Lung | 65 (22.0) | |
| Prostate | 40 (13.0) | |
| Stage at Diagnosis | Stage 1 | 45 (15.0) |
| Stage 2 | 55 (18.0) | |
| Stage 3 | 70 (23.0) | |
| Stage 4 | 80 (27.0) | |
| Stage 5 | 50 (17.0) | |
| Total | 300 (100) | |
Figure 1: Distribution of diagnosed cancer types among participants.
Baseline demographic and clinical characteristics of the study population (N = 300) presented frequency distributions of self-reported health measures across 14 domains using a 5-point Likert scale (1 = Strongly Disagree to 5 = Strongly Agree). There was high endorsement of familial/social support, awareness of blood test significance, belief in test-based disease tracking, and trust in medical care.
Regarding moderate-to-high symptom burden, 58% reported daily cancer-related pain, 55% reported symptom interference in daily activities, and 60% experienced frequent fatigue. Negative health perception was expressed by only 22%; rated overall health as excellent (53% disagreed), while 41% perceived rapid health decline, and 52% reported health-related distress. Gaps in supportive care were evidenced by 42% disagreeing about the receipt of nutritional counseling at diagnosis. QoL perceptions were mixed (39% were positive, 27% were negative, and 34% were neutral). Responses clustered near the scale midpoint, indicating variability in subjective experiences, despite homogeneous clinical demographics.
| Table 2: Baseline self-reported health characteristics of the study population a | |||||
| Self-Report Health Measure | Strongly Disagree |
Disagree |
Neutral |
Agree |
Strongly Agree |
| Daily cancer-related pain intensity | 27 (9) | 39 (13) | 60 (20) | 112 (37) | 62 (21) |
| Symptom-related functional impairment | 21 (7) | 45 (15) | 69 (23) | 114 (38) | 51 (17) |
| High-frequency cancer-related fatigue | 15 (5) | 33 (11) | 72 (24) | 126 (42) | 54 (18) |
| Self-rated overall health status | 78 (26) | 81 (27) | 75 (25) | 48 (16) | 18 (6) |
| Perceived rapid health decline | 39 (13) | 69 (23) | 69 (23) | 90 (30) | 33 (11) |
| Health-related emotional distress | 33 (11) | 42 (14) | 69 (23) | 108 (36) | 48 (16) |
| Perceived familial/social support | 12 (4) | 18 (6) | 33 (11) | 111 (37) | 126 (42) |
| Adherence to dietary self-care | 15 (5) | 24 (8) | 72 (24) | 126 (42) | 63 (21) |
| Receipt of nutritional counseling | 54 (18) | 72 (24) | 90 (30) | 60 (20) | 24 (8) |
| Treatment literacy (self-reported) | 18 (6) | 24 (8) | 78 (26) | 123 (41) | 57 (19) |
| Informed about treatment side effects | 27 (9) | 51 (17) | 81 (27) | 102 (34) | 39 (13) |
| Awareness of diagnostic blood testing | 9 (3) | 18 (6) | 54 (18) | 147 (49) | 72 (24) |
| Belief in test-based disease tracking | 6 (2) | 9 (3) | 54 (18) | 144 (48) | 87 (29) |
| Perceived cancer-related quality of life | 30 (10) | 51 (17) | 102 (34) | 87 (29) | 30 (10) |
| Trust in cancer-related medical care | 12 (4) | 15 (5) | 60 (20) | 135 (45) | 78 (26) |
| Self-reported items (rows 5 onward) used a 5-point Likert scale (1 = Strongly Disagree; 5 = Strongly Agree). Data are expressed as the mean ± standard deviation (SD), and minimum/maximum scores were noted. | |||||
As shown in Table 3, the Pearson correlations examining relationships between demographic/clinical variables (age, gender, cancer type, stage) and patient-reported symptom/health perception measures revealed minimal associations for objective factors: age demonstrated negligible, non-significant correlations with all symptom/health variables (|r| ≤ 0.081, all p> 0.16), and cancer stage (|r| ≤ 0.077, all p>0.18). Minor exceptions included a weak inverse correlation between sex (women) and poorer self-rated health (r = −0.115, P = 0.047) and a modest positive correlation between cancer type and health-related distress (r = 0.175, P = 0.002).
Conversely, strong and significant intercorrelations emerged within the symptom cluster, notably between pain intensity and functional impairment (r = 0.477, p<0.01) and between functional impairment and fatigue (r = 0.901, p< .01). Higher symptom burden was consistently correlated with negative health perceptions, including perceived health decline (e.g., pain: r = 0.328, p<0.01) and distress (e.g., fatigue vs. anxiety: r = 0.232, p<0.01). Poor self-rated health was also weakly correlated with higher symptom interference (r = −0.100, P < 0.01) and fatigue (r = −0.084, P < 0.05). Collectively, these findings indicate that objective demographic and clinical factors (age and stage) are largely unrelated to subjective experiences, whereas symptom burden forms a highly coherent cluster that is strongly predictive of adverse health perceptions.
| Table 3: Correlations among demographic, clinical, and patient-reported symptom measures | |||||||||||
| Variables | |||||||||||
| Age | r | 1 | .013 | .044 | .014 | -.014 | .006 | -.049 | .081 | .071 | .051 |
| P-value | .823 | .451 | .814 | .813 | .924 | .402 | .163 | .220 | .379 | ||
| Gender | r | .013 | 1 | .045 | .062 | -.083 | .034 | -.038 | -.115* | .005 | -.024 |
| P-value | .823 | .435 | .287 | .152 | .563 | .515 | .047 | .938 | .684 | ||
| Type of cancer diagnosed | r | .044 | .045 | 1 | -.017 | -.014 | .061 | -.086 | .015 | -.038 | .175** |
| P-value | .451 | .435 | .771 | .811 | .294 | .138 | .797 | .513 | .002 | ||
| Stage of cancer at diagnosis | r | .014 | .062 | -.017 | 1 | .041 | .032 | -.077 | .006 | -.048 | .082 |
| P-value | .814 | .287 | .771 | .477 | .586 | .186 | .921 | .404 | .155 | ||
| Daily cancer-related pain intensity | r | -.014 | -.083 | -.014 | .041 | 1 | -.039 | -.050 | -.001 | -.007 | -.057 |
| P-value | .813 | .152 | .811 | .477 | .496 | .391 | .983 | .901 | .328 | ||
| Symptom-related functional impairment | r | .006 | .034 | .061 | .032 | -.039 | 1 | -.015 | -.001 | -.007 | -.069 |
| P-value | .924 | .563 | .294 | .586 | .496 | .795 | .983 | .900 | .236 | ||
| High-frequency cancer-related fatigue | r | -.049 | -.038 | -.086 | -.077 | -.050 | -.015 | 1 | -.100 | .080 | .069 |
| P-value | .402 | .515 | .138 | .186 | .391 | .795 | .084 | .165 | .232 | ||
| Self-rated overall health status | r | .081 | -.115* | .015 | .006 | -.001 | -.001 | -.100 | 1 | -.096 | .024 |
| P-value | .163 | .047 | .797 | .921 | .983 | .983 | .084 | .098 | .674 | ||
| Perceived rapid health decline | r | .071 | .005 | -.038 | -.048 | -.007 | -.007 | .080 | -.096 | 1 | .022 |
| P-value | .220 | .938 | .513 | .404 | .901 | .900 | .165 | .098 | .705 | ||
| Health-related emotional distress | r | .051 | -.024 | .175** | .082 | -.057 | -.069 | .069 | .024 | .022 | 1 |
| P-value | .379 | .684 | .002 | .155 | .328 | .236 | .232 | .674 | .705 | ||
As shown in Table 4, correlational analyses examined the relationships among patient-reported support, health behaviors, treatment information, and confidence in care. Critically, most support and information variables (e.g., familial support and treatment literacy) exhibited non-significant trivial correlations with confidence in care (absolute r ≤ 0.085, all P > 0.14). Key exceptions were a significant negative correlation between receiving nutritional counseling and dietary adherence (r = −0.163, P = 0.005), indicating that advice receipt did not equate to behavioral change, and a positive correlation between awareness of blood test significance and belief in disease-tracking utility (r = 0.166, P = 0.004).
| Table 4: Correlations among support, health behaviors, information, and confidence | ||||||||||
| Variable | ||||||||||
| Perceived familial/social support | r | 1 | .005 | .010 | .051 | .008 | -.042 | .011 | .044 | .019 |
| P-value | .930 | .865 | .381 | .889 | .473 | .852 | .446 | .737 | ||
| Adherence to dietary self-care | r | .005 | 1 | -.163* | -.096 | -.028 | -.001 | -.031 | .006 | .000 |
| P-value | .930 | .005 | .097 | .627 | .989 | .598 | .913 | .995 | ||
| Receipt of nutritional counseling | r | .010 | -.163** | 1 | -.029 | .002 | -.054 | -.074 | .090 | -.068 |
| P-value | .865 | .005 | .615 | .969 | .349 | .204 | .120 | .239 | ||
| Treatment literacy (self-reported) | r | .051 | -.096 | -.029 | 1 | .057 | .033 | .031 | .055 | -.079 |
| P-value | .381 | .097 | .615 | .327 | .570 | .594 | .344 | .172 | ||
| Informed about treatment side effects | r | .008 | -.028 | .002 | .057 | 1 | .056 | .009 | -.009 | -.085 |
| P-value | .889 | .627 | .969 | .327 | .332 | .871 | .882 | .142 | ||
| Awareness of diagnostic blood testing | r | -.042 | -.001 | -.054 | .033 | .056 | 1 | -.038 | .166** | -.053 |
| P-value | .473 | .989 | .349 | .570 | .332 | .512 | .004 | .360 | ||
| Belief in test-based disease tracking | r | .011 | -.031 | -.074 | .031 | .009 | -.038 | 1 | -.019 | -.062 |
| P-value | .852 | .598 | .204 | .594 | .871 | .512 | .743 | .287 | ||
| Perceived cancer-related quality of life | r | .044 | .006 | .090 | .055 | -.009 | .166** | -.019 | 1 | .023 |
| P-value | .446 | .913 | .120 | .344 | .882 | .004 | .743 | .686 | ||
| Trust in cancer-related medical care | r | .019 | .000 | -.068 | -.079 | -.085 | -.053 | -.062 | .023 | 1 |
| P-value | .737 | .995 | .239 | .172 | .142 | .360 | .287 | .686 | ||
Dominant predictors emerged as perceived QoL, demonstrating strong positive correlations with both beliefs in test-based monitoring (r = 0.743, P < 0.001) and confidence in care (r = 0.686, P < 0.001); no other variable approached this association magnitude with confidence (absolute r < 0.10). Factors such as social support, dietary adherence, treatment information, and side-effect explanations showed no meaningful link to confidence (absolute r ≤ 0.085, P*0 > 0.12). Consequently, confidence in care was overwhelmingly driven by patients’ perceived QoL and belief in monitoring efficacy, overshadowing traditional support and information metrics.
Hierarchical multiple regression analysis revealed that neither patient age nor cancer stage at diagnosis significantly predicted their confidence in medical care. The model incorporating both predictors (age and stage) accounted for a negligible proportion of the variance in confidence scores (R² = 0.003) and was statistically non-significant (F (2, 297) = 0.401, P = 0.670). Standardized coefficients confirmed minimal and non-significant effects of age (β = 0.008, P = 0.895) and cancer stage (β = 0.051, P = 0.377). These results indicate that objective demographic and disease-severity factors do not meaningfully influence cancer patients' confidence in their healthcare.
| Table 5: Regression analysis of demographic and clinical factors as predictors of patient confidence in medical care. | ||||||
| Model | Unstandardized Coefficients | Standardized Coefficients | t | P-value | ||
| B | Std. Error | Beta | ||||
| 1 | (Constant) | 2.801 | 0.274 | 10.212 | 0.000 | |
| Age | 0.001 | 0.004 | 0.008 | 0.133 | 0.895 | |
| Stage of cancer at diagnosis | 0.047 | 0.054 | 0.051 | 0.884 | 0.377 | |
| a. Dependent Variable: I am confident in the medical care I am receiving for my cancer.
b. Predictors: (Constant), stage of cancer at diagnosis, age Model (R2 = 0.003) F-ratio (0.401) The model is not statistically significant (P = 0.670). |
||||||
The distribution of standardized residuals from the regression predicting confidence in medical care was approximately normal and centered on zero (mean ≈ 0, D ≈ 1), with most residuals falling between –2 and +2. There was no pronounced skewness or extreme outliers, as shown in Figure 2.
Figure 2: Histogram of standardized regression residuals for the patient confidence model
4. DISCUSSION
The present study examined the demographic, clinical, and patient-reported factors influencing cancer patients’ confidence in the medical care they received. In brief, neither age nor stage of cancer at diagnosis predicted confidence, and the traditional information provision and social support items were largely unrelated to trust in care. Instead, the patients’ self-assessed quality-of-life and belief in test-based monitoring were the strongest correlates of confidence.
The finding that demographic and disease severity factors do not meaningfully shape patient confidence aligns with a study by Suhonen, et al. who found that cancer patients' age, gender, and level of education were not related to their assessments of care quality attributes, such as person-centered care quality, individuality in care, and trust in nurses.11 Similarly, a study by Khullar, et al. indicates that patient trust in clinicians is primarily influenced by aspects of care, such as satisfaction with explanations, overall satisfaction with the provider, and understanding of medical conditions, rather than patient characteristics, such as age or illness stage.12 The study found that these factors accounted for a significant portion of the variance in patient trust, emphasizing the importance of clinician-patient interactions in fostering trust rather than demographic or clinical factors. In contrast, inequalities in cancer care experiences by age and gender have been documented in national patient-experience surveys, with younger and female patients sometimes reporting poorer ratings of care; the study did not replicate those disparities, perhaps reflecting differences in measurement or setting. Crucially, patient-centered communication has repeatedly emerged as a key driver of trust and satisfaction in oncology; newly diagnosed patients who perceive their clinicians as empathetic and informative report higher trust irrespective of clinical factors. Moreover, broader oncology satisfaction studies emphasize that expectations and treatment engagement, more than objective clinical markers, underlie patients’ overall ratings of care,13,14
The correlations suggest that patients’ confidence rests on their subjective appraisal of illness control and well-being, rather than on external characteristics. This align with work of Ugur, et al. and Rajapakse that showed that symptom burden shapes patients’ illness perceptions and coping modes: among early-stage lung cancer survivors, higher symptom distress predicted more threatening illness representations and greater cancer-related worry, which in turn undermined confidence in treatment plans.15,16 Likewise, in adolescent and young adult cancer cohorts, symptom severity has been linked to psychological distress and lower perceived agency in care decisions.17 From a theoretical standpoint, these patterns accord with the Common-Sense Model frameworks of self-regulation, wherein symptom experiences drive cognitive and emotional representations of illness that guide coping and trust in one’s health team.18 Biologically, uncontrolled symptoms perpetuate stress-response activation, dysregulating HPA axis function and heightening fatigue and anxiety, which further erodes perceived self-efficacy.19 Over time, this feedback loop can lead patients to question the adequacy of their medical management when their lived symptom reality diverges from the expectations of control.
The present findings underscore that bolstering patients’ confidence in care may depend more on enhancing symptom management and reinforcing their sense of agency than on demographic tailoring. Clinicians should prioritize routine, systematic assessment of symptom burden using validated PRO tools and respond promptly with tailored interventions (e.g., pain management, fatigue mitigation, psychosocial support). Integrating patient-centered communication training into oncology practice can strengthen patients’ illness representations and align expectations with treatment goals20. Educating patients on how laboratory markers reflect disease status may also reinforce confidence since belief in test-based monitoring was a key correlate of trust in sample. Finally, embedding self-management support (e.g., fatigue self-care strategies and cognitive coping techniques) can interrupt the symptom-stress cycle and preserve patient confidence in clinicians’ expertise.
5. Strengths & Limitations
The strengths of this study include its large, heterogeneous sample (N = 300), comprehensive assessment of both objective (age, stage) and subjective (symptoms, beliefs) factors, and rigorous evaluation of statistical assumptions. However, its cross-sectional design precludes causal inferences; while symptom burden and illness beliefs are linked to confidence, the directionality of these relationships remains to be confirmed. Self-reported measures may introduce response biases, and sample drawn from a single cancer center may not be generalizable to other cultural or healthcare settings. Future longitudinal and interventional studies should clarify whether targeting symptom control and illness perceptions can causally enhance patient confidence, and ultimately, treatment adherence and outcomes. In addition, future research should integrate qualitative methods to explore the relationship between patients’ subjective experiences and trust in healthcare, with attention to cultural and contextual variations in quality of life perceptions
6. CONCLUSION
In this large sample of cancer patients, neither demographic factors nor disease stage predicted confidence in medical care; instead, patients’ perceptions of their QoL and belief in the value of test-based monitoring were most closely linked to trust. These findings suggest that efforts to enhance patient confidence should focus on comprehensive symptom management, clear explanations of monitoring strategies, and reinforcement of patients’ self-efficacy. Future longitudinal studies are needed to test whether interventions targeting these subjective experiences can strengthen trust and improve adherence in oncology settings.
- Acknowledgments
- Data availability
- Conflict of interest
- Funding
- Ethics considerations
- Authors’ contribution
13. REFERENCES
- McFarland DC, Grassi L, Riba MB. The Relational Component of Trust in Oncology. The Complex Role of Patient Trust in Oncology. Springer; 2024:1-23.
- Davis SA, Feldman SR. Optimizing the Physician-Patient Relationship and Educating the Patient About Adherence. Adherence in Dermatology. 2016:143-150.
- Richards ST. Trust in physician. The international Encyclopedia of health communication. 2023:1-4.
- Nartey Y, Tata LJ, Khakwani A, et al. Using patient experiences to evaluate care and expectations in lung cancer: analysis of the English Cancer Patient Experience Survey linked with the national cancer registry. Supportive Care in Cancer. 2022;30(5):4417-4428.
- Gilmore N, Jean N, Loh N, et al. Abstract B029: Communication barriers: The role of medical mistrust in patient-centered communication in cancer care among Black and White older patients with cancer receiving treatment. Cancer Epidemiology, Biomarkers & Prevention. 2024;33(9_Supplement):B029-B029.
- Joshy G, Khalatbari-Soltani S, Soga K, et al. Pain and its interference with daily living in relation to cancer: a comparative population-based study of 16,053 cancer survivors and 106,345 people without cancer. BMC cancer. 2023;23(1):774.
- Rizka Y, Deli H, Dewi WN, Putriana N. PREDICTIVE FACTORS ASSOCIATED TOWARDS QUALITY OF LIFE IN PATIENTS WITH CANCER: A CROSS-SECTIONAL STUDY. Nurse and Health: Jurnal Keperawatan. 2024;13(2):248-258.
- Hale ED, Treharne G, Kitas G. The common-sense model of self-regulation of health and illness: how can we use it to understand and respond to our patients’ needs? : Oxford University Press; 2007.
- Zhang X, Li L, Zhang Q, Le LH, Wu Y. Physician empathy in doctor-patient communication: A systematic review. Health communication. 2024;39(5):1027-1037.
- George D, Mallery P. IBM SPSS statistics 26 step by step: A simple guide and reference. Routledge; 2019.
- Suhonen R, Stolt M, Berg A, et al. Cancer patients' perceptions of quality‐of‐care attributes—Associations with age, perceived health status, gender and education. Journal of clinical nursing. 2018;27(1-2):306-316.
- Khullar D, Prasad K, Neprash H, et al. Factors associated with patient trust in their clinicians: results from the healthy work place study. Health Care Management Review. 2022;47(4):289-296.
- Samant R, Cisa-Paré E, Balchin K, et al. Assessment of patient satisfaction among cancer patients undergoing radiotherapy. Journal of Cancer Education. 2022:1-8.
- Prakash A, Sardar M, Shaikh N, et al. The perspective of a breast cancer patient: a survey study assessing needs and expectations. Cureus. 2020;12(7)
- Ugur O, Karadag E, Mert H, Sahin CK, Gurel T, Karakus HS. Examining the relationship between symptoms watched in lung cancer patients and illness perception. Pain. 2022;17(18.23):0-50.
- Rajapakse P. An update on survivorship issues in lung cancer patients. World journal of oncology. 2021;12(2-3):45.
- Baclig NV, Comulada WS, Ganz PA. Mental health symptom severity and health care utilization in adolescent and young adult cancer survivors. American Society of Clinical Oncology; 2022.
- Hagger MS, Orbell S. The common sense model of illness self-regulation: a conceptual review and proposed extended model. Health psychology review. 2022;16(3):347-377.
- Karin O, Raz M, Tendler A, et al. Hormonal dysregulation after prolonged HPA axis activation can be explained by changes of adrenal and corticotroph masses. bioRxiv. 2020;