Karar Sabah Thijeel 1, Mahdi Murshd Thuwaini 2, Alaa Kadhim Jasim 3, Hamid Jaddoa Jaddoa Abbas 4
Authors affiliations:
Background & Objective: Iron overload, a common complication of sickle cell disease (SCD), ultimately leads to liver fibrosis. Early detection is critical for successful management and noninvasive biomarkers can guide the clinicians. Mac-2 binding protein glycosylation isomer (M2BPGi) and matrix metalloproteinase (MMP-9) are potential biomarkers; however, their diagnostic utility in iron overload-induced liver fibrosis remains unclear. We evaluated the predictive efficacy of the serum M2BPGi and MMP-9 levels as biomarkers of iron overload-induced liver fibrosis in SCD patients.
Methodology: This case-control study involved 42 SCD patients and 50 healthy controls at the Genetic Hemoglobinopathies Center of Basra, Iraq. Three milliliters of whole blood were obtained via venipuncture from the patient and control groups and collected in gel separator vacuum blood collection tubes. Serum was separated and used for biochemical analyses. Serum M2BPGi and MMP-9 levels were determined via ELISA. Ferritin and liver function tests (LFT) were evaluated using automated analyzers.
Results: Significant increase in M2BPGi was recorded in SCD patients compared to the controls (37.39 ± 10.02 vs. 21.22 ± 6.36 pg/mL, P < 0.001). No significant difference in MMP-9 between SCD and control groups (406.45 ± 225.9 vs. 306.56 ± 270.85 ng/mL; (P = 0.068) respectively. The M2BPGi showed high sensitivity (93%) and high specificity (92%), with an area under curve (AUC) (94%), and was positively correlated with ferritin and LFT.
Conclusions: The M2BPGi is a promising non-invasive biomarker for detecting iron overload-induced liver fibrosis in SCD patients, whereas serum MMP-9 lacks the necessary sensitivity to be a reliable biomarker.
Abbreviations: AST: Serum aspartate, ALT: alanine aminotransferases, ECM: extracellular matrix, LFT: liver function tests, M2BPGi: Mac-2 binding protein glycosylation isomer, MMP-9: matrix metalloproteinase-9, SCD: sickle cell disease
Keywords: M2BPGi; Matrix Metalloproteinase-9; Sickle Cell Disease; Iron Overload; Liver Fibrosis
Citation: Thijeel KS, Thuwaini MM, Jasim AK, Abbas HJJ. Serum mac-2 binding protein glycosylation isomer and matrix metalloproteinase-9 as predictive biomarkers for iron overload-induced liver fibrosis in sickle cell disease. Anaesth. pain intensive care 2025;29(4):384-391. DOI: 10.35975/apic.v29i4.2826
Received: May 29, 2025; Revised: June 05, 2025; Accepted: June 06, 2025
Sickle cell disease is a hemoglobin disorder that has a significant impact on global health, with annual statistics showing that approximately 300000 new infants are born with SCD worldwide.1 This disease involves the production of hemoglobin S, leading to a qualitative defect in the hemoglobin structure and function.2,3 Sickle cell disease is characterized by sickle-shaped RBCs with polymerization of hemoglobin S under hypoxic conditions, which leads to RBCs fragility, RBC destruction (hemolysis), anemia, and blood vessel occlusion.4 In cases of severe anemia, blood transfusion is viewed as the cornerstone of management.5 Even so, repeated blood transfusions could expose patients to the risk of transfusional iron overload, which means that excess iron from transfused blood accumulates in vital organs.6 In addition, the bone marrow of anemic patients is in increased demand to produce RBCs (erythropoiesis) to compensate for the destruction of RBCs. During erythropoiesis, the bone marrow produces erythroferrone, a hormone that inhibits hepcidin production.7 Inhibition of hepcidin production aggravates iron overload in patients with SCD owing to an increase in gastrointestinal iron absorption.8
In SCD patients, significant morbidity and mortality are observed, resulting from excessive iron buildup in the endocrine glands, heart, and liver. Iron overload can lead to cardiomyopathies, heart failure, and endocrinopathies such as diabetes and gonadal dysfunction 9.
The liver the principal site of iron accumulation in cases of iron overload.10 Elevated liver iron levels in cause oxidation stress,11 inflammation,12 and ferroptosis (a programmed cellular death in liver cells).13 Following liver damage caused by these complications, liver fibrosis may occur, which is an abnormal deposition of scar tissue in the form of wound healing.14 This condition can pose a serious health risk, as it causes excessive buildup of extracellular matrix (ECM), leading subsequently to cirrhosis and hepatic cancer.15
Effective management of SCD requires early identification and regular assessment of hepatic fibrosis to stop its advancement to cirrhosis and malignancy.16 Liver biopsy is regarded as an imperfect golden standard for diagnosis of hepatic fibrosis due to many considerations such as its intra- and inter-observer variability, invasive nature, potential harm, and discomfort to the patient.17 Therefore, liver biopsy is not a practical method for frequent monitoring. Consequently, interest in the use of non-invasive biomarkers for detection and follow-up of hepatic fibrosis has increased, thereby avoiding the risks associated with biopsy.
Serum biomarkers offer a non-invasive, easy, and repeatable way for the assessment of liver fibrosis.18 Among these biomarkers, M2BPGi is a glycoprotein released from Ito cells along hepatic fibrosis advancement.19 Many studies had reported a significant correlation between M2BPGi levels and hepatic fibrosis in many liver diseases, including fatty liver disease,), autoimmune hepatitis and chronic hepatitis B.20 However, its significance in SCD-related iron overload-induced liver damage is underexplored. Another serum biomarker, MMP-9, is a zinc-dependent endopeptidase enzyme involved in tissue remodeling via ECM degradation.21 Matrix metalloproteinase-9 functions in the breakdown of ECM proteins, such as denatured collagen (gelatin), elastin, and type IV collagen.22 According to previous studies, MMP-9 appears to be a potential biomarker for liver fibrosis diagnosis,23 and its specific application in iron overload-induced fibrosis of the liver in patients with SCD remains underexplored. Limited evidence exists on the ability of serum M2BPGi/MMP-9 to differentiate iron-driven fibrosis from other etiologies in SCD, or their diagnostic accuracy relative to iron-specific pathophysiology.
This study aimed to address these gaps by systematically evaluating the performance of serum M2BPGi and MMP-9 as biomarkers of iron overload-induced liver fibrosis in SCD.
This case-control study included 92 patients. The study encompassed 42 patients with SCD (aged 14–55 years) attending the Genetic Hemoglobinopathies Center of Basra, Iraq. Patients with other hemoglobinopathies, other liver diseases, cancer, chronic or autoimmune diseases, those who had undergone major surgery during the last 3 months, and pregnant and lactating mothers were excluded. None of the patients had undergone a blood transfusion in the last three months, and they were not taking iron-chelating drugs. Patients with ferritin levels < 1000 ng/mL were classified into Group A, as this is linked to enhanced survival rates and better liver function,24 whereas patients with ferritin levels ≥ 1000 ng/mL were classified as Group B. The control group was comprised of 50 samples obtained from healthy volunteers. These individuals were selected to match the sex and age distribution of the patients, which ranged from 14 to 55 years. All control subjects had normal hemoglobin variants without a family history of hemoglobinopathies, chronic or autoimmune diseases, or current inflammation or infection. They had no history of smoking, recent blood transfusions, major surgery, or antibiotics or drugs that may have affected the current study parameters.
2.1. Sample collection
Three milliliters of whole blood were obtained via venipuncture from the patient and control groups and collected in gel separator vacuum blood collection tubes. Serum was separated and used for biochemical analyses.
2.2. Laboratory analysis
Serum aspartate and alanine aminotransferases (AST and ALT), and direct and total bilirubin (DB and TSB) were quantified for all participants using an Architect c4000 analyzer (USA). Indirect bilirubin (IDB) levels were calculated using the following formula (total bilirubin and direct bilirubin). Serum ferritin was measured to evaluate body iron status in all subjects using a Cobas e411 analyzer (Germany). Patients with ferritin levels above 2000 ng/mL were evaluated using the dilution method because the sensitivity of Cobas e411 is limited to values below 2000 ng/ml. The serum levels of M2BPGi and MMP-9 were estimated via enzyme immunoassay (ELISA) kits from FineTest, China [Catalogue numbers for M2BPGi: EH4477, MMP-9: EH0283].
2.3. Statistical analysis
Statistical analysis was done with the SPSS version 26 program (IBM, USA). Numerical data were assessed using an independent sample t-test to compare groups and evaluate differences. Qualitative data were analyzed was using the chi-square test. The threshold for statistical significance was established at P < 0.05.
Regarding the demographic characteristics of the study groups, the SCD group comprised 42 participants; 59.5%male, 40.5% female, whereas control group comprised 50 participants (58% male, 42% female) (P = 0.882). The mean age in SCD group vs. control group was 26.38 ± 12.3 vs. 24.42 ± 7.92 years (P = 0.358). No significant differences were found in sex distribution or age among SCD and control groups.
Table 1 presents the comparative biochemical profiles of patients with SCD and controls. Patients with SCD showed elevated levels of TSB, DB, IDB, ALT, AST, and ferritin compared with controls.
Table 2 presents a comparative analysis of the serum M2BPGi and MMP-9 levels across the study groups. Significant difference was demonstrated across the comparison between SCD group and controls group (37.39 ± 10.02 vs. 21.22 ± 6.36 pg/mL, P < 0.001). No significant difference in MMP-9 was determined among the SCD and control groups (406.45 ± 225.9 vs. 306.56 ± 270.85 ng/mL, respectively; P = 0.061).
Table 3 shows the distribution of serum M2BPGi and MMP-9 biomarkers in relation to the ferritin in the SCD group. Group B patients demonstrated higher M2BPGi (39.9 ± 8.61 vs. 33.7 ± 8.31 pg/mL, P = 0.047) than Group A patients (< 1000 ng/mL). However, no statistically significant difference noted in MMP-9 (P = 0.591).
Table 4 presents the diagnostic efficacy of M2BPGi and MMP-9 using the receiver operating characteristic (ROC) curve analysis. The Mac-2 binding protein glycosylation isomer in the SCD group demonstrated a 23.4 pg/mL threshold, 93% sensitivity, and 92% specificity. The AUC for M2BPGi was 94% (Figure 1). MMP-9 failed to demonstrate adequate sensitivity, achieving only 52% despite its high specificity (90%). Its AUC was 55%.
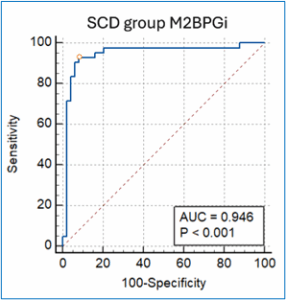
Figure 1: ROC curve of M2BPGi
The SCD group had significantly higher liver enzyme (ALT and AST) than control group. Increased liver enzyme levels in SCD are indicative of hepatocellular injury, which is associated with iron overload. These findings align with the current literature, such as Gazza et al. and Obi et al., who found elevated AST and ALT in SCD individuals compared to healthy controls.25,26
The total, direct, and indirect bilirubin were markedly elevated in SCD group. High indirect bilirubin levels are a result of hemolysis, whereas direct bilirubin elevation is due to liver damage or cholestasis,26 supporting iron overload effects. These results align with the current literature, such as that of Manganas et al., reporting higher direct and indirect bilirubin in SCD patients were correlated with advanced hepatic fibrosis.27
Ferritin was significantly elevated in SCD individuals. Iron overload is common in SCD due to frequent blood transfusions and hemolysis.28 In patients with SCD, chronic hemolysis and hemolytic crisis release heme-bound iron, which is scavenged and stored in the ferritin, leading to iron overload, particularly in those with repeated vaso-occlusive crises and frequent blood transfusions. Ferreira et al., stated that SCD patients demand multiple blood transfusions, ineffective prolonged erythropoiesis, and that hemolysis leads to iron overload.29
The association between ferritin levels and hepatic fibrosis align with the findings of previous studies. Chen et al. noted that higher ferritin was related to advanced liver fibrosis.30 Ferreira et al. also described that iron overload in SCD individuals can lead to liver fibrosis.29 Excess iron is toxic because the resulting increase in reactive oxygen species (ROS) formation leads to cell injury that promotes inflammation and induces fibrogenic pathways, eventually leading to Ito cells proliferation, activation, and collagen accumulation.31 Additionally, a recently defined type of controlled cellular death, ferroptosis, has a critical role in iron overload, hepatic damage, and fibrosis.13 Ohta et al. suggested that iron buildup in the liver is a strong profibrogenic and carcinogenic mediator.32
The markedly elevated M2BPGi levels, especially in patients with ferritin levels ≥1000 ng/mL, suggest increased fibrogenic activity, as M2BPGi is a circulating glycoprotein released from activated Ito cells along with the progression of fibrosis.19,33 Many previous studies have reported increasing M2BPGi at the fibrosis stage in chronic hepatic conditions, including viral hepatitis and non-alcoholic fatty liver disease (NAFLD), and that it can reliably detect advanced fibrosis.34 For instance, in a study by Moon et al. on 231 NAFLD patients, M2BPGi alone achieved an AUC of 82.3% for advanced fibrosis.35 Similarly, Bui et al. conducted a study on 177 Vietnamese chronic hepatitis B (CHB) patients and found that M2BPGi achieved strong agreement with the results of ultrasound-based fibrosis imaging techniques (FibroScan).20 They also noted that M2BPGi serves as a messenger between Ito cells and Kupffer cells, reflecting both liver fibrosis and inflammation. Bestari et al. supported the inclusion of M2BPGi in the assessment framework of fibrosis based on a study of 143 CHB patients.36 A systematic review by Liu et al. validated the use of M2BPGi as an effective marker for staging of hepatic fibrosis in individuals with viral hepatitis and NAFLD, with an AUC of 81% for extensive fibrosis.37 Tangvoraphonkchai et al. reported an AUC of 98.3% for M2BPGi to distinguish between HCV patients with hepatic fibrosis and healthy individuals.38 When M2BPGi was accompanied by AST, GGT, age, and platelet count (AGAP), a specificity of 100% and AUC of 90.5% for liver fibrosis detection were achieved, according to the study by Pramono et al., which enrolled 109 research subjects with chronic hepatitis B.39 However, no published studies have directly discussed the levels of M2BPGi in patients specifically. In the current study, increased M2BPGi levels distinguished patients from controls and identified those at a high risk of fibrosis (Group B). Elevated M2BPGi levels in patients with high ferritin likely reflect iron‐driven fibrotic changes, such as Ito cells activation and ECM turnover, as chronic iron overload is a strong fibrogenic stimulus.32 Activated Ito cells release M2BPGi along with other matrix components, as revealed by Fujita and Masaki.40
These results suggest the effectiveness of M2BPGi as a predictive biomarker for fibrosis in SCD, which could otherwise be overlooked (especially since aminotransferases can be intermittently normal). Importantly, the levels of M2BPGi could serve as an early warning marker and aid in risk stratification. Among the patients with ferritin levels ≥1000 ng/mL, those with the highest M2BPGi levels were more likely to have more pronounced fibrotic changes. Additionally, the persistently rising M2BPGi levels over time might identify those at risk of cirrhosis or HCC, as Kamada et al. reported an increased incidence of cirrhosis and HCC with liver fibrosis progression, and that higher M2BPGi were related to increased mortality in liver cirrhosis and were associated with cancer recurrence after HCC curative therapy.41
The levels of MMP-9 in serum differ significantly from those in plasma, as Jonsson et al. indicated in their study, which included 67 subjects and found higher MMP-9 levels in the serum than in plasma.42 Studies on SCD patients have evaluated MMP-9 levels in the plasma; however, no studies have determined MMP-9 in serum of patients with SCD. Badr et al. conducted a study on 75 SCD patients and 75 healthy controls and found significantly elevated plasma MMP-9 levels in SCD patients compared with healthy controls.43 However, serum MMP-9 levels were not determined. Factors such as in vitro release of WBCs (particularly neutrophils) and platelet-stored MMP-9 during clotting and platelet activation might make the serum levels of MMP-9 much higher than its plasma levels.42 Therefore, it can be concluded that measuring plasma MMP-9 levels may be a better reflection of its circulating levels and might show a significant difference compared to healthy controls and better correlation with disease in these patients, as plasma MMP-9 levels are less affected by in vitro factors. Another explanation for the results could be the presence of higher levels of tissue inhibitors of metalloproteinases (TIMPs) in SCD patients. Fujita K and Masaki T and Witarto et al. reported increased TIMP-1 and M2BPGi during Ito cells activation and fibrogenesis (MMP-9 can be inhibited by increased TIMP-1).40,44 The modest diagnostic performance of ROC analysis suggests that serum MMP-9 has limited utility as a biomarker in these conditions. Nonetheless, the observed trend toward increased serum MMP-9 levels in SCD patients and in patients with ferritin levels exceeding 1000 nanograms per milliliter compared to those with ferritin levels <1000 ng/mL indicates that MMP-9 might still play a role in disease pathophysiology, particularly in relation to iron overload.
Longitudinal studies are essential to determine whether M2BPGi can track the progression of liver fibrosis in SCD patients over time. Larger longitudinal studies on patients with hemoglobinopathies should focus on confirming the use of M2BPGi as a predictive biomarker and exploring its specificity for iron overload against other causes of liver injury to enhance its clinical reliability. Further studies are required for evaluation of usefulness of serum MMP-9 in risk stratification of SCD patients, and plasma MMP-9 should be investigated in large longitudinal studies to assess the possibility of its use as a predictive biomarker for iron overload-induced liver fibrosis in SCD patients.
This study revealed that M2BPGi levels were markedly higher in SCD individuals compared to healthy controls and correlated with ferritin levels, which supports its use as a noninvasive biomarker for iron overload-induced liver fibrosis in SCD patients, whereas the low sensitivity of MMP-9 constrains its utility as a reliable biomarker. Further investigation is warranted to determine the clinical utility and diagnostic efficacy of M2BPGi for the detection and monitoring of liver fibrosis in patients with SCD. Further studies should examine the potential of MMP-9 for risk stratification in patients with SCD.
7. Data availability
The numerical data generated during this research is available with the authors.
8. Conflict of interest
All authors declare that there was no conflict of interest.
9. Funding
The study utilized the hospital resources only, and no external or industry funding was involved.
10. Authors’ contribution
All authors took equal part in the conduct of the study, data registering, statistical analysis and literature search. All authors approved the final manuscript.
Authors affiliations:
- Karar Sabah Thijeel, College of Health and Medical Techniques, Southern Technical University, Basrah, Iraq; Email: karar.s.thejeel@fgs.stu.edu.iq; {ORCID:0009-0001-6413-6770}
- Mahdi Murshd Thuwaini, College of Health and Medical Techniques/Al-Basrah, Southern Technical University, Iraq; Email: Mahdi.murshd@stu.edu.iq; {ORCID:0000-0002-7607-3076}
- Alaa Kadhim Jasim, College of Health and Medical Techniques/Al-Basrah, Southern Technical University, Iraq; Email: alaa_alderawi@stu.edu.iq; {ORCID:0000-0002-4955-3293}
- Hamid Jaddoa Jaddoa Abbas, Al-Faiha’a Teaching Hospital, Al- Zehra’a Medical College, University of Basrah, Basrah, Iraq; Email: hamed@uobasrah.edu.iq; {ORCID:0009-0006-7499-3828}
ABSTRACT
Background & Objective: Iron overload, a common complication of sickle cell disease (SCD), ultimately leads to liver fibrosis. Early detection is critical for successful management and noninvasive biomarkers can guide the clinicians. Mac-2 binding protein glycosylation isomer (M2BPGi) and matrix metalloproteinase (MMP-9) are potential biomarkers; however, their diagnostic utility in iron overload-induced liver fibrosis remains unclear. We evaluated the predictive efficacy of the serum M2BPGi and MMP-9 levels as biomarkers of iron overload-induced liver fibrosis in SCD patients.
Methodology: This case-control study involved 42 SCD patients and 50 healthy controls at the Genetic Hemoglobinopathies Center of Basra, Iraq. Three milliliters of whole blood were obtained via venipuncture from the patient and control groups and collected in gel separator vacuum blood collection tubes. Serum was separated and used for biochemical analyses. Serum M2BPGi and MMP-9 levels were determined via ELISA. Ferritin and liver function tests (LFT) were evaluated using automated analyzers.
Results: Significant increase in M2BPGi was recorded in SCD patients compared to the controls (37.39 ± 10.02 vs. 21.22 ± 6.36 pg/mL, P < 0.001). No significant difference in MMP-9 between SCD and control groups (406.45 ± 225.9 vs. 306.56 ± 270.85 ng/mL; (P = 0.068) respectively. The M2BPGi showed high sensitivity (93%) and high specificity (92%), with an area under curve (AUC) (94%), and was positively correlated with ferritin and LFT.
Conclusions: The M2BPGi is a promising non-invasive biomarker for detecting iron overload-induced liver fibrosis in SCD patients, whereas serum MMP-9 lacks the necessary sensitivity to be a reliable biomarker.
Abbreviations: AST: Serum aspartate, ALT: alanine aminotransferases, ECM: extracellular matrix, LFT: liver function tests, M2BPGi: Mac-2 binding protein glycosylation isomer, MMP-9: matrix metalloproteinase-9, SCD: sickle cell disease
Keywords: M2BPGi; Matrix Metalloproteinase-9; Sickle Cell Disease; Iron Overload; Liver Fibrosis
Citation: Thijeel KS, Thuwaini MM, Jasim AK, Abbas HJJ. Serum mac-2 binding protein glycosylation isomer and matrix metalloproteinase-9 as predictive biomarkers for iron overload-induced liver fibrosis in sickle cell disease. Anaesth. pain intensive care 2025;29(4):384-391. DOI: 10.35975/apic.v29i4.2826
Received: May 29, 2025; Revised: June 05, 2025; Accepted: June 06, 2025
1. INTRODUCTION
Sickle cell disease is a hemoglobin disorder that has a significant impact on global health, with annual statistics showing that approximately 300000 new infants are born with SCD worldwide.1 This disease involves the production of hemoglobin S, leading to a qualitative defect in the hemoglobin structure and function.2,3 Sickle cell disease is characterized by sickle-shaped RBCs with polymerization of hemoglobin S under hypoxic conditions, which leads to RBCs fragility, RBC destruction (hemolysis), anemia, and blood vessel occlusion.4 In cases of severe anemia, blood transfusion is viewed as the cornerstone of management.5 Even so, repeated blood transfusions could expose patients to the risk of transfusional iron overload, which means that excess iron from transfused blood accumulates in vital organs.6 In addition, the bone marrow of anemic patients is in increased demand to produce RBCs (erythropoiesis) to compensate for the destruction of RBCs. During erythropoiesis, the bone marrow produces erythroferrone, a hormone that inhibits hepcidin production.7 Inhibition of hepcidin production aggravates iron overload in patients with SCD owing to an increase in gastrointestinal iron absorption.8
In SCD patients, significant morbidity and mortality are observed, resulting from excessive iron buildup in the endocrine glands, heart, and liver. Iron overload can lead to cardiomyopathies, heart failure, and endocrinopathies such as diabetes and gonadal dysfunction 9.
The liver the principal site of iron accumulation in cases of iron overload.10 Elevated liver iron levels in cause oxidation stress,11 inflammation,12 and ferroptosis (a programmed cellular death in liver cells).13 Following liver damage caused by these complications, liver fibrosis may occur, which is an abnormal deposition of scar tissue in the form of wound healing.14 This condition can pose a serious health risk, as it causes excessive buildup of extracellular matrix (ECM), leading subsequently to cirrhosis and hepatic cancer.15
Effective management of SCD requires early identification and regular assessment of hepatic fibrosis to stop its advancement to cirrhosis and malignancy.16 Liver biopsy is regarded as an imperfect golden standard for diagnosis of hepatic fibrosis due to many considerations such as its intra- and inter-observer variability, invasive nature, potential harm, and discomfort to the patient.17 Therefore, liver biopsy is not a practical method for frequent monitoring. Consequently, interest in the use of non-invasive biomarkers for detection and follow-up of hepatic fibrosis has increased, thereby avoiding the risks associated with biopsy.
Serum biomarkers offer a non-invasive, easy, and repeatable way for the assessment of liver fibrosis.18 Among these biomarkers, M2BPGi is a glycoprotein released from Ito cells along hepatic fibrosis advancement.19 Many studies had reported a significant correlation between M2BPGi levels and hepatic fibrosis in many liver diseases, including fatty liver disease,), autoimmune hepatitis and chronic hepatitis B.20 However, its significance in SCD-related iron overload-induced liver damage is underexplored. Another serum biomarker, MMP-9, is a zinc-dependent endopeptidase enzyme involved in tissue remodeling via ECM degradation.21 Matrix metalloproteinase-9 functions in the breakdown of ECM proteins, such as denatured collagen (gelatin), elastin, and type IV collagen.22 According to previous studies, MMP-9 appears to be a potential biomarker for liver fibrosis diagnosis,23 and its specific application in iron overload-induced fibrosis of the liver in patients with SCD remains underexplored. Limited evidence exists on the ability of serum M2BPGi/MMP-9 to differentiate iron-driven fibrosis from other etiologies in SCD, or their diagnostic accuracy relative to iron-specific pathophysiology.
This study aimed to address these gaps by systematically evaluating the performance of serum M2BPGi and MMP-9 as biomarkers of iron overload-induced liver fibrosis in SCD.
2. METHODOLOGY
This case-control study included 92 patients. The study encompassed 42 patients with SCD (aged 14–55 years) attending the Genetic Hemoglobinopathies Center of Basra, Iraq. Patients with other hemoglobinopathies, other liver diseases, cancer, chronic or autoimmune diseases, those who had undergone major surgery during the last 3 months, and pregnant and lactating mothers were excluded. None of the patients had undergone a blood transfusion in the last three months, and they were not taking iron-chelating drugs. Patients with ferritin levels < 1000 ng/mL were classified into Group A, as this is linked to enhanced survival rates and better liver function,24 whereas patients with ferritin levels ≥ 1000 ng/mL were classified as Group B. The control group was comprised of 50 samples obtained from healthy volunteers. These individuals were selected to match the sex and age distribution of the patients, which ranged from 14 to 55 years. All control subjects had normal hemoglobin variants without a family history of hemoglobinopathies, chronic or autoimmune diseases, or current inflammation or infection. They had no history of smoking, recent blood transfusions, major surgery, or antibiotics or drugs that may have affected the current study parameters.
2.1. Sample collection
Three milliliters of whole blood were obtained via venipuncture from the patient and control groups and collected in gel separator vacuum blood collection tubes. Serum was separated and used for biochemical analyses.
2.2. Laboratory analysis
Serum aspartate and alanine aminotransferases (AST and ALT), and direct and total bilirubin (DB and TSB) were quantified for all participants using an Architect c4000 analyzer (USA). Indirect bilirubin (IDB) levels were calculated using the following formula (total bilirubin and direct bilirubin). Serum ferritin was measured to evaluate body iron status in all subjects using a Cobas e411 analyzer (Germany). Patients with ferritin levels above 2000 ng/mL were evaluated using the dilution method because the sensitivity of Cobas e411 is limited to values below 2000 ng/ml. The serum levels of M2BPGi and MMP-9 were estimated via enzyme immunoassay (ELISA) kits from FineTest, China [Catalogue numbers for M2BPGi: EH4477, MMP-9: EH0283].
2.3. Statistical analysis
Statistical analysis was done with the SPSS version 26 program (IBM, USA). Numerical data were assessed using an independent sample t-test to compare groups and evaluate differences. Qualitative data were analyzed was using the chi-square test. The threshold for statistical significance was established at P < 0.05.
3. RESULTS
Regarding the demographic characteristics of the study groups, the SCD group comprised 42 participants; 59.5%male, 40.5% female, whereas control group comprised 50 participants (58% male, 42% female) (P = 0.882). The mean age in SCD group vs. control group was 26.38 ± 12.3 vs. 24.42 ± 7.92 years (P = 0.358). No significant differences were found in sex distribution or age among SCD and control groups.
Table 1 presents the comparative biochemical profiles of patients with SCD and controls. Patients with SCD showed elevated levels of TSB, DB, IDB, ALT, AST, and ferritin compared with controls.
| Table 1: Comparative analysis of biochemical markers among study groups. | |||
| Biomarkers | SCD group
(n = 42) |
Control group
(n = 50) |
P-value |
| TSB (mg/dL) | 3.10 ± 2.32 | 0.64 ± 0.28 | < 0.001 |
| DB (mg/dL) | 0.99 ± 0.85 | 0.24 ± 0.16 | < 0.001 |
| IDB (mg/dL) | 2.10 ± 1.55 | 0.4 ± 0.19 | < 0.001 |
| ALT (U/L) | 39.31 ± 27.75 | 22.60 ± 12.06 | < 0.001 |
| AST (U/L) | 50.24 ± 33.45 | 23.90 ± 6.63 | < 0.001 |
| ferritin (ng/mL) | 642.75 ± 854.02 | 40.56 ± 37.11 | < 0.001 |
| Independent sample t-test; P < o.o5 considered as significant | |||
Table 2 presents a comparative analysis of the serum M2BPGi and MMP-9 levels across the study groups. Significant difference was demonstrated across the comparison between SCD group and controls group (37.39 ± 10.02 vs. 21.22 ± 6.36 pg/mL, P < 0.001). No significant difference in MMP-9 was determined among the SCD and control groups (406.45 ± 225.9 vs. 306.56 ± 270.85 ng/mL, respectively; P = 0.061).
| Table 2: Levels of study fibrosis biomarkers among the study groups. | |||
| Biomarkers | SCD group
(n = 42) |
Control group
(n = 50) |
P-value |
| M2BPGi (pg/mL) | 37.39 ± 10.02 | 21.22 ± 6.36 | < 0.001 |
| Serum MMP-9 (ng/mL) | 406.45 ± 225.9 | 306.56 ± 270.85 | 0.061 |
| Independent sample t-test; P < 0.05 considered as significant | |||
Table 3 shows the distribution of serum M2BPGi and MMP-9 biomarkers in relation to the ferritin in the SCD group. Group B patients demonstrated higher M2BPGi (39.9 ± 8.61 vs. 33.7 ± 8.31 pg/mL, P = 0.047) than Group A patients (< 1000 ng/mL). However, no statistically significant difference noted in MMP-9 (P = 0.591).
| Table 3: Association between ferritin levels and biomarker distribution in SCD Group. | |||
| Biomarkers | SCD group | ||
| Group A
(n = 32) |
Group B
(n = 10) |
P-value | |
| M2BPGi (pg/mL) | 33.7 ± 8.31 | 39.9 ± 8.61 | 0.047 |
| Serum MMP-9 (ng/mL) | 403 ± 206 | 443 ± 198 | 0.591 |
| Independent sample t-test. P < o.o5 considered as significant | |||
Table 4 presents the diagnostic efficacy of M2BPGi and MMP-9 using the receiver operating characteristic (ROC) curve analysis. The Mac-2 binding protein glycosylation isomer in the SCD group demonstrated a 23.4 pg/mL threshold, 93% sensitivity, and 92% specificity. The AUC for M2BPGi was 94% (Figure 1). MMP-9 failed to demonstrate adequate sensitivity, achieving only 52% despite its high specificity (90%). Its AUC was 55%.
Figure 1: ROC curve of M2BPGi
| Table 4: Diagnostic performance of M2BPGi and MMP-9 biomarkers. | |||||||
| Biomarkers | Cut-off value | Sens % | Spec % | PPV | NPV | AUC% | P-value |
| M2BPGi (pg/mL) | >23.4 | 93 | 92 | 91 | 94 | 94 | < 0.001 |
| Serum MMP-9 (ng/mL) | >775.5 | 52 | 90 | 85 | 58 | 55 | 0.5 |
4. DISCUSSION
The SCD group had significantly higher liver enzyme (ALT and AST) than control group. Increased liver enzyme levels in SCD are indicative of hepatocellular injury, which is associated with iron overload. These findings align with the current literature, such as Gazza et al. and Obi et al., who found elevated AST and ALT in SCD individuals compared to healthy controls.25,26
The total, direct, and indirect bilirubin were markedly elevated in SCD group. High indirect bilirubin levels are a result of hemolysis, whereas direct bilirubin elevation is due to liver damage or cholestasis,26 supporting iron overload effects. These results align with the current literature, such as that of Manganas et al., reporting higher direct and indirect bilirubin in SCD patients were correlated with advanced hepatic fibrosis.27
Ferritin was significantly elevated in SCD individuals. Iron overload is common in SCD due to frequent blood transfusions and hemolysis.28 In patients with SCD, chronic hemolysis and hemolytic crisis release heme-bound iron, which is scavenged and stored in the ferritin, leading to iron overload, particularly in those with repeated vaso-occlusive crises and frequent blood transfusions. Ferreira et al., stated that SCD patients demand multiple blood transfusions, ineffective prolonged erythropoiesis, and that hemolysis leads to iron overload.29
The association between ferritin levels and hepatic fibrosis align with the findings of previous studies. Chen et al. noted that higher ferritin was related to advanced liver fibrosis.30 Ferreira et al. also described that iron overload in SCD individuals can lead to liver fibrosis.29 Excess iron is toxic because the resulting increase in reactive oxygen species (ROS) formation leads to cell injury that promotes inflammation and induces fibrogenic pathways, eventually leading to Ito cells proliferation, activation, and collagen accumulation.31 Additionally, a recently defined type of controlled cellular death, ferroptosis, has a critical role in iron overload, hepatic damage, and fibrosis.13 Ohta et al. suggested that iron buildup in the liver is a strong profibrogenic and carcinogenic mediator.32
The markedly elevated M2BPGi levels, especially in patients with ferritin levels ≥1000 ng/mL, suggest increased fibrogenic activity, as M2BPGi is a circulating glycoprotein released from activated Ito cells along with the progression of fibrosis.19,33 Many previous studies have reported increasing M2BPGi at the fibrosis stage in chronic hepatic conditions, including viral hepatitis and non-alcoholic fatty liver disease (NAFLD), and that it can reliably detect advanced fibrosis.34 For instance, in a study by Moon et al. on 231 NAFLD patients, M2BPGi alone achieved an AUC of 82.3% for advanced fibrosis.35 Similarly, Bui et al. conducted a study on 177 Vietnamese chronic hepatitis B (CHB) patients and found that M2BPGi achieved strong agreement with the results of ultrasound-based fibrosis imaging techniques (FibroScan).20 They also noted that M2BPGi serves as a messenger between Ito cells and Kupffer cells, reflecting both liver fibrosis and inflammation. Bestari et al. supported the inclusion of M2BPGi in the assessment framework of fibrosis based on a study of 143 CHB patients.36 A systematic review by Liu et al. validated the use of M2BPGi as an effective marker for staging of hepatic fibrosis in individuals with viral hepatitis and NAFLD, with an AUC of 81% for extensive fibrosis.37 Tangvoraphonkchai et al. reported an AUC of 98.3% for M2BPGi to distinguish between HCV patients with hepatic fibrosis and healthy individuals.38 When M2BPGi was accompanied by AST, GGT, age, and platelet count (AGAP), a specificity of 100% and AUC of 90.5% for liver fibrosis detection were achieved, according to the study by Pramono et al., which enrolled 109 research subjects with chronic hepatitis B.39 However, no published studies have directly discussed the levels of M2BPGi in patients specifically. In the current study, increased M2BPGi levels distinguished patients from controls and identified those at a high risk of fibrosis (Group B). Elevated M2BPGi levels in patients with high ferritin likely reflect iron‐driven fibrotic changes, such as Ito cells activation and ECM turnover, as chronic iron overload is a strong fibrogenic stimulus.32 Activated Ito cells release M2BPGi along with other matrix components, as revealed by Fujita and Masaki.40
These results suggest the effectiveness of M2BPGi as a predictive biomarker for fibrosis in SCD, which could otherwise be overlooked (especially since aminotransferases can be intermittently normal). Importantly, the levels of M2BPGi could serve as an early warning marker and aid in risk stratification. Among the patients with ferritin levels ≥1000 ng/mL, those with the highest M2BPGi levels were more likely to have more pronounced fibrotic changes. Additionally, the persistently rising M2BPGi levels over time might identify those at risk of cirrhosis or HCC, as Kamada et al. reported an increased incidence of cirrhosis and HCC with liver fibrosis progression, and that higher M2BPGi were related to increased mortality in liver cirrhosis and were associated with cancer recurrence after HCC curative therapy.41
The levels of MMP-9 in serum differ significantly from those in plasma, as Jonsson et al. indicated in their study, which included 67 subjects and found higher MMP-9 levels in the serum than in plasma.42 Studies on SCD patients have evaluated MMP-9 levels in the plasma; however, no studies have determined MMP-9 in serum of patients with SCD. Badr et al. conducted a study on 75 SCD patients and 75 healthy controls and found significantly elevated plasma MMP-9 levels in SCD patients compared with healthy controls.43 However, serum MMP-9 levels were not determined. Factors such as in vitro release of WBCs (particularly neutrophils) and platelet-stored MMP-9 during clotting and platelet activation might make the serum levels of MMP-9 much higher than its plasma levels.42 Therefore, it can be concluded that measuring plasma MMP-9 levels may be a better reflection of its circulating levels and might show a significant difference compared to healthy controls and better correlation with disease in these patients, as plasma MMP-9 levels are less affected by in vitro factors. Another explanation for the results could be the presence of higher levels of tissue inhibitors of metalloproteinases (TIMPs) in SCD patients. Fujita K and Masaki T and Witarto et al. reported increased TIMP-1 and M2BPGi during Ito cells activation and fibrogenesis (MMP-9 can be inhibited by increased TIMP-1).40,44 The modest diagnostic performance of ROC analysis suggests that serum MMP-9 has limited utility as a biomarker in these conditions. Nonetheless, the observed trend toward increased serum MMP-9 levels in SCD patients and in patients with ferritin levels exceeding 1000 nanograms per milliliter compared to those with ferritin levels <1000 ng/mL indicates that MMP-9 might still play a role in disease pathophysiology, particularly in relation to iron overload.
5. LIMITATIONS / FUTURE DIRECTION
Longitudinal studies are essential to determine whether M2BPGi can track the progression of liver fibrosis in SCD patients over time. Larger longitudinal studies on patients with hemoglobinopathies should focus on confirming the use of M2BPGi as a predictive biomarker and exploring its specificity for iron overload against other causes of liver injury to enhance its clinical reliability. Further studies are required for evaluation of usefulness of serum MMP-9 in risk stratification of SCD patients, and plasma MMP-9 should be investigated in large longitudinal studies to assess the possibility of its use as a predictive biomarker for iron overload-induced liver fibrosis in SCD patients.
6. CONCLUSION
This study revealed that M2BPGi levels were markedly higher in SCD individuals compared to healthy controls and correlated with ferritin levels, which supports its use as a noninvasive biomarker for iron overload-induced liver fibrosis in SCD patients, whereas the low sensitivity of MMP-9 constrains its utility as a reliable biomarker. Further investigation is warranted to determine the clinical utility and diagnostic efficacy of M2BPGi for the detection and monitoring of liver fibrosis in patients with SCD. Further studies should examine the potential of MMP-9 for risk stratification in patients with SCD.
7. Data availability
The numerical data generated during this research is available with the authors.
8. Conflict of interest
All authors declare that there was no conflict of interest.
9. Funding
The study utilized the hospital resources only, and no external or industry funding was involved.
10. Authors’ contribution
All authors took equal part in the conduct of the study, data registering, statistical analysis and literature search. All authors approved the final manuscript.
11. REFERENCES
- Sadeq HS, Abdulkareem AS, Dawood QM, Khalaf AA. Sonographic assessment of splenic manifestations in sickle cell disease and its relation to hematologic parameters. Cureus. 2024;16(10):e72322. PubMed DOI: 7759/cureus.72322
- GBD 2021 Sickle Cell Disease Collaborators. Global, regional, and national prevalence and mortality burden of sickle cell disease, 2000-2021: a systematic analysis from the Global Burden of Disease Study 2021. Lancet Haematol. 2023;10(8):e585-99. PubMed DOI: 1016/S2352-3026(23)00118-7
- Ahmed MN. Sickle cell anaemia and anesthetic management. Anaesth Pain Intensive Care. 2000;4(1). Full Text
- Dong M, McGann PT. Changing hydroxyurea treatment paradigm for sickle cell anemia via precision medicine. Clin Pharmacol Ther. 2021;109(1):73-81. PubMed DOI: 1002/cpt.2028
- Tanhehco Y, Shi P. Transfusion in patients with haemoglobinopathies. In: Practical Transfusion Medicine; 2022. p.409-16. DOI: 1002/9781119665885.ch34
- Shah FT, Porter JB, Sadasivam N, Kaya B, Moon JC, Velangi M, et al. Iron overload monitoring and management in haemoglobinopathies and rare anaemias. Br J Haematol. 2022;196(2):336-50. PubMed DOI: 1111/bjh.17839
- Srole DN, Ganz T. Erythroferrone: structure, function, physiology. J Cell Physiol. 2021;236(7):4888-901. PubMed DOI: 1002/jcp.30247
- Singh P, Millson C, Driver R. Hereditary haemochromatosis: a review. J R Coll Physicians Edinb. 2024. PubMed DOI: 1177/14782715241298724
- Entezari S, Haghi SM, Norouzkhani N, Sahebnazar B, Vosoughian F, Akbarzadeh D, et al. Iron chelators in treatment of iron overload. J Toxicol. 2022;2022(1):4911205. PubMed DOI: 1155/2022/4911205
- Pinyopornpanish K, Tantiworawit A, Leerapun A, Soontornpun A, Thongsawat S. Secondary iron overload and the liver: a review. J Clin Transl Hepatol. 2023;11(4):932. PubMed DOI: 14218/JCTH.2022.00420
- Yuan Q, Fang Y, Guo J, Zhang Z, Liao J, Kuang J. Rifaximin for iron overload-induced ferroptosis and liver fibrosis. Toxicol Appl Pharmacol. 2024;484:116845. PubMed DOI: 1016/j.taap.2024.116845
- Dhar D, Baglieri J, Kisseleva T, Brenner DA. Liver fibrosis and liver cancer mechanisms. Exp Biol Med. 2020;245(2):96-108. PubMed DOI: 1177/1535370219898141
- Kouroumalis E, Tsomidis I, Voumvouraki A. Iron as a therapeutic target in liver disease. World J Gastroenterol. 2023;29(4):616. PubMed DOI: 3748/wjg.v29.i4.616
- Salomao MA. Pathology of hepatic iron overload. Clin Liver Dis. 2021;17(4):232-7. PubMed DOI: 1002/cld.1051
- Pei Q, Yi Q, Tang L. Liver fibrosis resolution: molecular mechanisms and therapies. Int J Mol Sci. 2023;24(11):9671. PubMed DOI: 3390/ijms24119671
- Tagliaferro M, Marino M, Basile V, Pocino K, Rapaccini GL, Ciasca G, et al. New biomarkers in liver fibrosis. J Pers Med. 2024;14(8):798. PubMed DOI: 3390/jpm14080798
- Vincent JP, Ndow G, Ogawa S, Ceesay A, Njie R, Sanneh B, et al. M2BPGi for liver fibrosis and cancer in HBV patients in West Africa. J Glob Health. 2022;12. PubMed DOI: 7189/jogh.12.04076
- Andriyas EA, Kushwaha N, Pant N, et al. Serum biomarkers for liver fibrosis: a review. World J Adv Res Rev. 2024;23(3):82-8. DOI: 30574/wjarr.2024.23.3.2630
- Gong S, Yu X, Li Q, Chen M, Yu S, Yang S. M2BPGi as diagnostic marker for liver fibrosis: meta-analysis. PeerJ. 2024;12:e17611. PubMed DOI: 7717/peerj.17611
- Bui HH, Nguyen ST-B, Phan ST, Nguyen KM, Nguyen CD. M2BPGi as liver fibrosis marker in chronic HBV. Dig Dis Sci. 2023;68(12):4407-17. PubMed DOI: 1007/s10620-023-08143-5
- Nikolov A, Popovski N, Hristova I. Collagenases MMP-1, MMP-13, and Tissue Inhibitors TIMP-1, TIMP-2: Their Role in Healthy and Complicated Pregnancy and Potential as Preeclampsia Biomarkers—A Brief Review. Appl Sci. 2020;10(21):7731. DOI: 3390/app10217731
- Behairy OG, El-Gendy SA, Ibrahim DY, Mansour AI, El-Shimi OS. M2BPGi as noninvasive tool for liver fibrosis in children. Hepatol Res. 2021;51(3):277-83. PubMed DOI: 1111/hepr.13608
- Mahmoud S, Mohmed R, Abd El Baki A, Abdel Azeem E, Saleh E. Serum soluble cluster of differentiation 163 (sCD163), matrix metalloproteinase 9 (MMP9) and cytokeratin 18 (CK18) levels as biomarkers for liver fibrosis in Egyptian chronic hepatitis C patients. Egypt J Pure Appl Sci. 2021;59(1):9-19. DOI: 21608/ejaps.2021.81019.1002
- Spasiano A, Meloni A, Costantini S, Quaia E, Cademartiri F, Cinque P, et al. Setting for "Normal" Serum Ferritin Levels in Patients with Transfusion-Dependent Thalassemia: Our Current Strategy. J Clin Med. 2021;10(24):5985. PubMed DOI: 3390/jcm10245985
- Gazza C, Wernecke E, Hazenberg E, et al. Correlation between Disease Biomarkers and Hemoglobin F Levels in Sickle Cell Patients. Blood. 2023;142:5312. DOI: 1182/blood-2023-190387
- Guerra Ruiz AR, Crespo J, López Martínez RM, Iruzubieta P, Casals Mercadal G, Lalana Garcés M, et al. Measurement and clinical usefulness of bilirubin in liver disease. Adv Lab Med. 2021;2(3):352-61. PubMed DOI: 1515/almed-2021-0047
- Manganas K, Delicou S, Xydaki A, et al. Predisposing factors for advanced liver fibrosis in patients with sickle cell disease. Br J Haematol. 2023;202(6):1192-8. PubMed DOI: 1111/bjh.18970
- Fortuna V, Lima J, Oliveira GF, Oliveira YS, Getachew B, Nekhai S, et al. Ferroptosis as an emerging target in sickle cell disease. Curr Res Toxicol. 2024;7:100181. PubMed DOI: 1016/j.crtox.2024.100181
- de Sousa Arantes Ferreira G, Ferreira CA, Watanabe ALC, Trevizoli NC, Murta MCB, Figueira AVF, et al. Liver Transplantation After Hematopoietic Stem Cell Transplant for the Treatment of Sickle Cell Disease: A Case Report. Transplant Proc. 2022;54(5):1394-7. PubMed DOI: 1016/j.transproceed.2022.03.047
- Chen Q, Gao M, Yang H, Mei L, Zhong R, Han P,, et al. Serum ferritin levels are associated with advanced liver fibrosis in treatment-naive autoimmune hepatitis. BMC Gastroenterol. 2022;22(1):23. PubMed DOI: 1186/s12876-022-02098-z
- Mehta KJ, Farnaud SJ, Sharp PA. Iron and liver fibrosis: Mechanistic and clinical aspects. World J Gastroenterol. 2019;25(5):521. PubMed DOI: 3748/wjg.v25.i5.521
- Ohta K, Ito M, Chida T, Nakashima K, Sakai S, Kanegae Y, et al. Role of hepcidin upregulation and proteolytic cleavage of ferroportin 1 in hepatitis C virus-induced iron accumulation. PLoS Pathog. 2023;19(8):e1011591. PubMed DOI: 1371/journal.ppat.1011591
- Hur M, Park M, Moon H-W, Choe WH, Lee CH. Comparison of non-invasive clinical algorithms for liver fibrosis in patients with chronic hepatitis B to reduce the need for liver biopsy: application of enhanced liver fibrosis and Mac-2 binding protein glycosylation isomer. Ann Lab Med. 2022;42(2):249-57. PubMed DOI: 3343/alm.2022.42.2.249
- Kamada Y, Morishita K, Koseki M, et al. Serum Mac-2 binding protein levels associate with metabolic parameters and predict liver fibrosis progression in subjects with fatty liver disease: a 7-year longitudinal study. Nutrients. 2020;12(6):1770. PubMed DOI: 3390/nu12061770
- Moon SY, Baek YH, Jang SY, Jun DW, Yoon KT, Cho YY, et al. Proposal of a novel serological algorithm combining FIB-4 and serum M2BPGi for advanced fibrosis in nonalcoholic fatty liver disease. Gut Liver. 2023;18(2):283. PubMed DOI: 5009/gnl230128
- Bestari MB, Haryono H, Wijaya MP, Girawan D, Agustanti N, Nugraha ES. Revisiting Mac-2-Binding Protein Glycosylation Isomer (M2BPGi) for Diagnosing High-Risk Liver Fibrosis: A Stepwise Diagnostic Analysis. F1000Res. 2024;13:280. PubMed DOI: 12688/f1000research.147153.2
- Liu X, Zhang W, Ma B, Lv C, Sun M, Shang Q. The value of serum Mac-2 binding protein glycosylation isomer in the diagnosis of liver fibrosis: a systematic review and meta-analysis. Front Physiol. 2024;15:1382293. PubMed DOI: 3389/fphys.2024.1382293
- Tangvoraphonkchai K, Suttichaimongkol T, Kularbkaew C, Sangaimwibool P, Sukeepaisarnjaroen W. Application of Mac-2 binding protein glycosylation isomer as a non-invasive biomarker for probing liver disease. Sci Rep. 2022;12(1):6757. PubMed DOI: 1038/s41598-022-10744-5
- Pramono LK, Tjandrawati A, Turbawaty DK, Rostini T, Bestari MB, Haryono, et al. Macrophage-2-Binding Protein Glycosylation Isomer (M2BPGi) and AGAP Score as Markers of Noninvasive Test for Liver Fibrosis versus FibroScan in Chronic Hepatitis B Patients: A Retrospective Observational Study. Int J Hepatol. 2024;2024(1):6635625. PubMed DOI: 1155/2024/6635625
- Fujita K, Masaki T. Serum biomarkers of liver fibrosis staging in the era of the concept “Compensated advanced chronic liver disease”. J Clin Med. 2021;10(15):3340. PubMed DOI: 3390/jcm10153340
- Kamada Y, Sumida Y, Takahashi H, Fujii H, Miyoshi E, Nakajima A. Utility of Mac-2 binding protein glycosylation isomer as an excellent biomarker for the prediction of liver fibrosis, activity, and hepatocellular carcinoma onset: an expert review. J Gastroenterol. 2024:10-23. PubMed DOI: 1007/s00535-024-02179-8
- Jonsson A, Hjalmarsson C, Falk P, Ivarsson M-L. Levels of matrix metalloproteinases differ in plasma and serum–aspects regarding analysis of biological markers in cancer. Br J Cancer. 2016;115(6):703-6. PubMed DOI: 1038/bjc.2016.127
- Badr M, Hassan T, Shehab M, Raafat N, Hanna D. Assessment of plasma level of matrix metalloproteinase-9 in patients with sickle cell disease and its relationship to myocardial iron overload: a case–control study. Alexandria J Pediatr. 2022;35(2):131-6. DOI: 10.4103/ajop.ajop_29_22
- Witarto AP, Witarto BS, Pramudito SL, Putra AJE, Nurhadi GM, Maimunah U. Baseline serum Mac-2 binding protein glycosylation isomer as a predictor of hepatocellular carcinoma in chronic hepatitis B patients: a systematic review and meta-analysis. Ann Gastroenterol. 2022;35(6):627. PubMed DOI: 20524/aog.2022.0751