Sadiq Hassan Hadi 1, Abdul-samad Uleiwi Hassan 2, Redha Dawud Abd Alredha 3
Authors affiliations:
Background & objective: Gestational diabetes mellitus (GDM) is a common pregnancy related complication and is associated with insulin resistance and adverse perinatal outcomes. Reduced adiponectin, a hormone that regulates glucose and insulin sensitivity, has been implicated in GDM pathogenesis. We evaluated the association between serum adiponectin levels and insulin resistance in parturients with GDM and normoglycemic pregnancies, and to assess its diagnostic potential.
Methodology: A cross‐sectional study was conducted on pregnant women (24–36 weeks gestation) classified as GDM or controls per established criteria. Fasting blood samples were analyzed for glucose, insulin, and adiponectin, and insulin resistance was estimated using the HOMA‐IR index. Statistical analyses included correlation, regression, and ROC curve analysis.
Results: Compared to controls, GDM patients had significantly higher BMI, fasting glucose, insulin, and HOMA‐IR, but markedly lower adiponectin levels. Adiponectin showed a strong inverse correlation with insulin resistance markers, and ROC analysis confirmed its excellent diagnostic accuracy for GDM.
Conclusion: Reduced adiponectin is closely linked to increased insulin resistance in GDM, highlighting its potential as a diagnostic biomarker and therapeutic target.
Abbreviations: GDM: Gestational diabetes mellitus, IL-6: interleukin-6, TNF-α: tumor necrosis factor-alpha, OGTT: oral glucose tolerance test. PPAR-α: peroxisome proliferator-activated receptor alpha, AMPK: AMP-activated protein kinase.
Keywords: Gestational Diabetes Mellitus; Adiponectin; Insulin Resistance; HOMA-IR; Diagnostic Biomarker; Pregnancy,
Citation: Hadi SH, Hassan ASU, Abd Alredha RD. Adiponectin and insulin resistance in gestational diabetes: a comparative cross-sectional study. Adiponectin and insulin resistance in gestational diabetes: a comparative cross-sectional study. Anaesth. pain intensive care 2025;29(3):422-429. DOI: 10.35975/apic.v29i3.2753
Received: February 16, 2025; Revised: February 19, 2025; Accepted: March 24, 2025
Gestational diabetes mellitus (GDM) is a prevalent metabolic disorder that complicates between 5% and 25% of pregnancies worldwide.1 GDM is characterized by varying degrees of glucose intolerance first recognized during pregnancy and is associated with significant short- and long-term health risks for both mothers and their offspring, including an elevated risk of developing type 2 diabetes mellitus later in life.1
Although the etiology of GDM is multifactorial, the development of insulin resistance represents a central pathogenic mechanism, exacerbated by the hormonal alterations and increased adiposity inherent to pregnancy.1 Adiponectin, an adipocyte-derived hormone, has attracted considerable attention because of its insulin-sensitizing, anti-inflammatory, and cardioprotective properties. Paradoxically, adiponectin levels are reduced in conditions of obesity and insulin resistance, thereby predisposing individuals to metabolic disorders such as GDM.2
Adiponectin, also known as Acrp30, is an adipocyte-secreted hormone that plays a pivotal role in modulating insulin sensitivity. Its action is mediated through binding to two primary receptors, AdipoR1 and AdipoR2, which are predominantly expressed in skeletal muscle and liver, respectively.3 Activation of these receptors stimulates the AMP-activated protein kinase (AMPK) and peroxisome proliferator-activated receptor alpha (PPAR-α) pathways, thereby enhancing glucose uptake and fatty acid oxidation in muscle tissue while concurrently reducing hepatic gluconeogenesis.4 This dual mechanism is essential for maintaining glucose equilibrium and improving insulin sensitivity. In addition, adiponectin exerts anti-inflammatory effects by downregulating pro-inflammatory cytokines, including interleukin-6 (IL-6) and tumor necrosis factor-alpha (TNF-α), thus mitigating the inflammatory milieu commonly associated with insulin resistance.5
Recent investigations have documented a significant inverse association between circulating adiponectin levels and insulin resistance in both pregnant and non-pregnant populations. For instance, Begum M, et al. have reported diminished adiponectin concentrations in women with GDM compared to normoglycemic controls,5 a finding that has been corroborated by Moyce Gruber BL and Dolinsky VW, who observed a similar trend alongside elevated HOMA-IR values in GDM patients.6 These findings imply that decreased adiponectin may serve not only as a marker of metabolic dysfunction but also as a contributing factor in the pathophysiology of GDM through impaired insulin signaling.
Despite these advances, the precise role of adiponectin in the metabolic disturbances observed during gestation remains incompletely elucidated. Specifically, the interplay among adiponectin, insulin resistance markers, and glucose homeostasis during pregnancy has not been fully delineated, and discrepancies persist regarding the magnitude of these associations.7 Moreover, research evaluating the diagnostic performance of adiponectin as a biomarker for GDM—particularly in conjunction with traditional measures such as fasting insulin, the oral glucose tolerance test (OGTT), and the HOMA-IR index—remains limited.
Despite extensive previous research, key gaps remain regarding the variation of adiponectin levels with gestational age and body mass index (BMI) in GDM, as well as the underlying mechanisms linking adiponectin to insulin resistance. In view of these gaps, the present study aims to provide a comprehensive evaluation of adiponectin and its association with key glycemic parameters in pregnant women with GDM compared to normoglycemic controls. By examining these relationships across different gestational ages and body mass index (BMI) categories, this investigation seeks to elucidate the role of adiponectin in the development of insulin resistance during pregnancy. This study reinforces the potential diagnostic utility of adiponectin and explores its mechanistic implications in GDM pathogenesis, thereby contributing novel insights that may inform future therapeutic strategies. Ultimately, this research endeavors to enhance the understanding of the metabolic alterations underlying GDM and to advance the identification of reliable biomarkers for early detection and risk stratification, with the goal of improving clinical outcomes for mothers and their children.
2.1. Study Design and Ethical Considerations
A cross-sectional study was conducted between September 10, 2024, and February 10, 2025, at Al-Najaf Al-Ashraf Teaching Hospital, Al-Hakim General Hospital, and the Al-Mishkhab Primary Healthcare Sector in Najaf City, Iraq. The study protocol received approval from the Institutional Review Board (IRB) of the Najaf Health Directorate, Training and Human Development Center (Approval No. 33652) and complied with the ethical standards outlined in the Declaration of Helsinki.8 Informed written consent was obtained from all participants prior to enrollment.
2.2. Participant Recruitment and Selection
Pregnant women aged 18 to 40 years, in their second trimester (gestational weeks 13–26), were recruited from obstetrics consultation clinics at Al-Najaf Al-Ashraf Teaching Hospital and Al-Hakim General Hospital in Najaf City, Iraq. GDM was diagnosed based on OGTT, fasting blood glucose (FBS), and glycated hemoglobin (HbA1c) levels, in accordance with the standard diagnostic criteria of the American Diabetes Association (2023).9 Women with pre-existing diabetes (Type 1 or Type 2), multiple pregnancies, chronic inflammatory or autoimmune diseases, or those receiving medications known to affect glucose metabolism were excluded. Normoglycemic pregnant women meeting the same inclusion criteria were recruited from the Al-Mishkhab Primary Healthcare Sector to serve as the control group.
2.3. Clinical Assessment and Anthropometry
A comprehensive clinical evaluation was performed for each participant. Height was measured to the nearest 0.1 cm using a calibrated stadiometer, and weight was determined using a digital weighing scale with participants wearing light clothing and no shoes. The body mass index (BMI) was calculated and classified as follows: normoweight (18.5–24.9 kg/m²), overweight (25.0–29.9 kg/m²), and obese (≥30.0 kg/m²).10 These BMI categories were utilized to examine the relationship between BMI and biomarker levels in both the GDM and control groups.
2.4. Sample Collection and Processing
Fasting venous blood samples were collected in the morning after an 8–12 hour overnight fast using standard venipuncture techniques. Blood was drawn into serum separator tubes and allowed to clot at room temperature for 30 min, after which the samples were centrifuged at 3,000 rpm for 10 minutes. The resulting serum was aliquoted and stored at –80°C until further analysis.
2.5. Biochemical Measurements
2.5.1. Glucose Measurement (FGT and OGTT):
FBS and post-OGTT plasma glucose levels were measured using the enzymatic glucose oxidase-peroxidase (GOD-POD) method. In this process, β-D-glucose is oxidized by glucose oxidase (GOD) to produce gluconic acid and hydrogen peroxide (H₂O₂). The hydrogen peroxide then reacts with phenol and 4-aminophenazone (4-AP) in the presence of peroxidase (POD), forming a red quinonimine dye, the intensity of which is proportional to the glucose concentration. Absorbance was measured at 505 nm.
The assay was conducted using a commercial glucose assay kit following the manufacturer’s protocol, ensuring accuracy and reliability. The reagent was stored at 2–8°C and used without additional preparation.
2.6.2. Fasting Insulin:
Serum fasting insulin levels were measured using an ELISA kit (BT Lab; Cat. No. E0010Hu) with a detection range of 1.56–100 μIU/mL and a sensitivity of 0.938 μIU/mL. Absorbance was read at 450 nm using a Para Medical microplate reader, and concentrations were determined from a standard curve.
2.5.3. Adiponectin:
Serum adiponectin levels were measured using a sandwich ELISA kit (BT Lab; Cat. No. E1550Hu) with a detection range of 0.2–60 mg/L and a sensitivity of 0.11 mg/L. Absorbance was measured at 450 nm, and assays followed the manufacturer’s protocols, with each sample analyzed in duplicate number.
2.5.4. Calculation of HOMA-IR:
insulin resistance was evaluated using the Homeostatic Model Assessment of Insulin Resistance (HOMA-IR) formula (11) as Following: Fasting Insulin (uU/ml×Fasting Glucose/405).
2.6. Statistical Analysis
Demographic characteristics and pregnancy outcomes were expressed as numbers and frequency distributions for categorical variables to compare between groups, the chi-squared test. Continuous variables expressed as mean ± standard division (SD) and independent t-test were performed for compare two groups, ANOVA with Tukey's post hoc test for compared three or more groups respectively. Linear regression models were conducted to estimate Standardized Coefficients Beta and t value of pregnancy with GDM and control. Pearson correlation between biomarkers and all studied parameters. Stratified analyses were performed according to Gestational age groups and pregnancy BMI. The predictive performance for GDM was evaluated by calculating the area under the receiver operating characteristic curve (ROC [AUC]) with cutoff point and 95% confidence interval. Analyses were carried out using SPSS software version 28 (IBM, UK). All P values are two-sided, and statistical significance was defined as P < 0.05 (Sullivan, 2022)
Table 1 demonstrates that the GDM group exhibited significantly elevated values for BMI, OGTT, FGT, and HOMA-IR compared to the control group (P < 0.001), while serum adiponectin levels were markedly reduced (3.94 ± 1.32 mg/L vs. 7.42 ± 2.05 mg/L). Although a slight yet statistically significant difference in gestational age was observed between the groups, the mean values were comparable; additionally, maternal age did not differ significantly (P = 0.48).
Figure 1 presents a comparative analysis of serum adiponectin levels between pregnant women with GDM and normoglycemic controls. The data reveal that the GDM group exhibits a significantly lower mean serum adiponectin concentration (3.94 mg/L) compared to the control group (7.42 mg/L), thereby reinforcing the association between reduced adiponectin levels and the metabolic dysregulation characteristic of GDM.
Table 2 illustrates those pregnant women with GDM consistently demonstrate higher OGTT and HOMA-IR values and lower serum adiponectin levels compared to normoglycemic controls across all BMI categories (normoweight, overweight, and obese). Although maternal age and gestational age did not differ significantly between groups (P > 0.05), insulin resistance markers increased progressively with BMI, particularly among GDM participants. Moreover, adiponectin levels exhibited a clear inverse relationship with BMI, remaining significantly lower in the GDM group relative to controls.
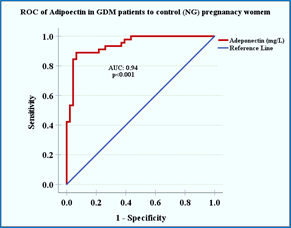
Figure 2. ROC curve of serum adiponectin for GDM vs. control pregnant women.
Among GDM patients, fasting insulin (P < 0.001), OGTT (P = 0.0001), and HOMA-IR (P < 0.001) values increased significantly as gestational age advanced, while adiponectin levels decreased notably (P < 0.001). In contrast, the control group exhibited minimal changes in these insulin resistance markers over the same time intervals, with differences in fasting
in sulin (P = 0.159), HOMA-IR (P = 0.126), and adiponectin (P = 0.206) remaining statistically non-significant (Table 3).
Table 4 demonstrates robust positive correlations among fasting insulin, OGTT, and HOMA-IR within the GDM group, accompanied by a statistically significant inverse association between these parameters and adiponectin (P < 0.05).
Table 5 indicates that adiponectin exhibits excellent discriminatory power, with an area under the curve (AUC) of 0.94 (P < 0.0001; 95% CI: 0.906–0.991). A cutoff value of 5.41 mg/L yielded a sensitivity of 88.9% and a specificity of 93.5% for distinguishing between GDM and normoglycemic pregnancies.
Figure 2 depicts the ROC curve, which demonstrates the robust diagnostic accuracy of adiponectin, with an AUC of 0.94 (P < 0.0001). Table 6 indicates that, in the GDM group, fasting insulin (β = -0.596, P < 0.001) and HOMA-IR (β = -0.659, P < 0.001) are significant negative predictors of adiponectin, thereby linking increased insulin resistance with lower adiponectin concentrations. Conversely, OGTT and FGIR did not exhibit significant associations. In the normoglycemic control group, no significant relationships were observed, suggesting that adiponectin levels remain stable in the absence of hyperinsulinemia. These findings
underscore the role of elevated insulin levels in the suppression of adiponectin in GDM.
The results of this study confirm that pregnant women with GDM exhibit markedly elevated insulin resistance indices, as evidenced by notably higher fasting insulin, OGTT, and HOMA-IR levels, alongside substantially lower adiponectin concentrations compared to normoglycemic controls. These metabolic disturbances intensify with advancing gestation, highlighting the progressive nature of insulin resistance in GDM. The strong inverse correlation between adiponectin and insulin resistance markers further underscores the critical role of this adipokine in glucose homeostasis during pregnancy. The findings of this study are consistent with several previous studies that have documented similar trends in adiponectin levels among women with GDM. For example, Cakina S, has reported considerably reduced adiponectin concentrations in GDM patients relative to controls, a finding that is consistent with the results observed in the current study.13 Likewise, Xie J and colleagues have demonstrated a significant increase in insulin resistance in GDM patients compared to normoglycemic pregnancies, echoing the pattern observed in this study.14
Further examination of the data stratified by BMI categories (normoweight, overweight, and obese) underscores the impact of adiposity on metabolic regulation. As shown in Table 2,
women with GDM in the overweight and obese groups exhibited markedly elevated insulin resistance markers (fasting insulin, OGTT, and HOMA-IR) compared to normal-weight counterparts, along with a notable reduction in adiponectin levels. These findings suggest that higher BMI exacerbates the metabolic disturbances characteristic of GDM, potentially due to an enhanced pro-inflammatory state and greater insulin resistance. This observation is consistent with Muntean M, et al. indicating that obesity amplifies the hormonal and inflammatory pathways implicated in gestational diabetes, thereby contributing to a more severe metabolic dysregulation.15
In the context of GDM, reduced adiponectin levels compromise the activation of the AMPK and PPAR-α pathways. This impairment leads to diminished glucose uptake, reduced fatty acid oxidation, and increased hepatic gluconeogenesis, all of which contribute to elevated insulin resistance. One plausible explanation for the observed reduction in adiponectin is the pro-inflammatory milieu characteristic of GDM.16 Excessive gestational weight gain or pre-existing obesity may
elevate levels of pro-inflammatory cytokines such as interleukin-6 (IL-6) and tumor necrosis factor-alpha
(TNF-α).17 These cytokines activate transcription factors, including nuclear factor-kappa B (NF-κB), which suppress adiponectin gene expression and diminish its insulin-sensitizing effects via the AMPK and PPAR-α pathways.18 Consequently, adiponectin deficiency exacerbates insulin resistance, perpetuating a vicious cycle of metabolic dysfunction.19
Furthermore, obesity, which is frequently associated with GDM, intensifies this dysregulation.20 Hypertrophied adipocytes in obese individuals secrete lower levels of adiponectin while releasing higher concentrations of inflammatory mediators.21 This imbalance further compromises adiponectin’s capacity to enhance insulin sensitivity, thereby contributing to hyperglycemia and the metabolic derangements characteristic of GDM. The progressive decline in adiponectin levels observed with advancing gestation may be attributed to the cumulative impact of these inflammatory and hormonal alterations.
Clinically, the diagnostic performance of serum adiponectin—as evidenced by the ROC analysis—suggests its potential as a valuable biomarker for early identification and risk stratification of GDM. Early detection is critical because it facilitates timely therapeutic interventions aimed at mitigating adverse perinatal outcomes. Building on previous research, this study offers a comprehensive evaluation of adiponectin in relation to multiple insulin resistance markers across various gestational ages and BMI categories. This approach reinforces the potential diagnostic utility of adiponectin and provides additional insights into its mechanistic role in GDM.
The strengths of this investigation include a well-characterized study population with BMI stratification, robust statistical analyses (including correlation and multivariate regression), and the application of ROC curves to assess diagnostic performance.
The cross-sectional design precludes causal inferences regarding the temporal relationship between adiponectin and insulin resistance. Moreover, although efforts were made to control for potential confounding variables; residual confounding factors such as dietary habits, physical activity, and socio-economic status—may still affect the observed associations. Additionally, the sample of the study was drawn from a relatively homogenous population at a single center, introducing a possibility of selection bias that could limit the generalizability of the findings to broader or more diverse populations. Future longitudinal studies with more diverse populations and comprehensive control of confounders are warranted to further elucidate these associations. Additionally, interventional trials assessing the efficacy of adiponectin-enhancing therapies—whether lifestyle-based or pharmacological—are needed to explore potential strategies for reducing GDM-associated complications.
In summary, the study demonstrates that pregnant women with GDM exhibit significantly higher insulin resistance and lower serum adiponectin levels compared to the controls. These findings underscore the critical role of adiponectin, not only as a diagnostic biomarker, but also as a potential target for therapeutic intervention in GDM. By elucidating the inverse relationship between adiponectin and key metabolic markers (fasting insulin, OGTT, and HOMA-IR), the study provides novel insights into the metabolic dysregulation underlying GDM. This study advances our understanding beyond mere associations, suggesting that modulation of adiponectin pathways could contribute to improved clinical management and outcomes in gestational diabetes. While the cross-sectional design and homogeneous sample limit the generalizability of the findings, these results pave the way for future longitudinal investigations aimed at validating adiponectin's predictive value and exploring its mechanistic role in GDM progression.
7. Data availability
The numerical data generated during this research is available with the authors.
8. Conflict of interest
All authors declare that there was no conflict of interest.
9. Funding
The study utilized the hospital resources only, and no external or industry funding was involved.
10. Acknowledgments
We extend our sincere gratitude to all participants who volunteered for this study, as their contribution was essential to its success. Our heartfelt appreciation goes to the dedicated medical and nursing staff at Al-Najaf Al-Ashraf Teaching Hospital, Al-Hakim General Hospital, and Al-Mishkhab Primary Healthcare Sector in Najaf, Iraq, for their invaluable assistance in patient recruitment and sample collection.
11. Authors’ contribution
SHH: conducted the experiments, collected data, and performed statistical analysis.
AUH: conceptualized and designed the study
RDA: contributed to data interpretation and manuscript drafting.
All authors participated in manuscript revision, provided critical intellectual input, and approved the final version for submission.
Authors affiliations:
- Sadiq Hassan Hadi, Department of Medical Laboratory Techniques, College of Health & Medical Techniques/ Kufa, Al_Furat Al_Awsat Technical University, 31003 Al-Kufa, Iraq; Email: sadeq.hadi.chm@student.atu.edu.iq; {ORCID:0009-0009-0599-3017}
- Abdul-samad Uleiwi Hassan, Department of Medical Laboratory Techniques, College of Health & Medical Techniques/ Kufa, Al_Furat Al_Awsat Technical University, 31003 Al-Kufa, Iraq; Email: samadovaabditch@atu.edu.iq; {ORCID:0000-0003-2957-4641}
- Redha Dawud Abd Alredha, Department of Medical Laboratory Techniques, College of Health & Medical Techniques/ Kufa, Al_Furat Al_Awsat Technical University, 31003 Al-Kufa, Iraq; Email: redha.alredha.chm@student.atu.edu.iq
ABSTRACT
Background & objective: Gestational diabetes mellitus (GDM) is a common pregnancy related complication and is associated with insulin resistance and adverse perinatal outcomes. Reduced adiponectin, a hormone that regulates glucose and insulin sensitivity, has been implicated in GDM pathogenesis. We evaluated the association between serum adiponectin levels and insulin resistance in parturients with GDM and normoglycemic pregnancies, and to assess its diagnostic potential.
Methodology: A cross‐sectional study was conducted on pregnant women (24–36 weeks gestation) classified as GDM or controls per established criteria. Fasting blood samples were analyzed for glucose, insulin, and adiponectin, and insulin resistance was estimated using the HOMA‐IR index. Statistical analyses included correlation, regression, and ROC curve analysis.
Results: Compared to controls, GDM patients had significantly higher BMI, fasting glucose, insulin, and HOMA‐IR, but markedly lower adiponectin levels. Adiponectin showed a strong inverse correlation with insulin resistance markers, and ROC analysis confirmed its excellent diagnostic accuracy for GDM.
Conclusion: Reduced adiponectin is closely linked to increased insulin resistance in GDM, highlighting its potential as a diagnostic biomarker and therapeutic target.
Abbreviations: GDM: Gestational diabetes mellitus, IL-6: interleukin-6, TNF-α: tumor necrosis factor-alpha, OGTT: oral glucose tolerance test. PPAR-α: peroxisome proliferator-activated receptor alpha, AMPK: AMP-activated protein kinase.
Keywords: Gestational Diabetes Mellitus; Adiponectin; Insulin Resistance; HOMA-IR; Diagnostic Biomarker; Pregnancy,
Citation: Hadi SH, Hassan ASU, Abd Alredha RD. Adiponectin and insulin resistance in gestational diabetes: a comparative cross-sectional study. Adiponectin and insulin resistance in gestational diabetes: a comparative cross-sectional study. Anaesth. pain intensive care 2025;29(3):422-429. DOI: 10.35975/apic.v29i3.2753
Received: February 16, 2025; Revised: February 19, 2025; Accepted: March 24, 2025
1. INTRODUCTION
Gestational diabetes mellitus (GDM) is a prevalent metabolic disorder that complicates between 5% and 25% of pregnancies worldwide.1 GDM is characterized by varying degrees of glucose intolerance first recognized during pregnancy and is associated with significant short- and long-term health risks for both mothers and their offspring, including an elevated risk of developing type 2 diabetes mellitus later in life.1
Although the etiology of GDM is multifactorial, the development of insulin resistance represents a central pathogenic mechanism, exacerbated by the hormonal alterations and increased adiposity inherent to pregnancy.1 Adiponectin, an adipocyte-derived hormone, has attracted considerable attention because of its insulin-sensitizing, anti-inflammatory, and cardioprotective properties. Paradoxically, adiponectin levels are reduced in conditions of obesity and insulin resistance, thereby predisposing individuals to metabolic disorders such as GDM.2
Adiponectin, also known as Acrp30, is an adipocyte-secreted hormone that plays a pivotal role in modulating insulin sensitivity. Its action is mediated through binding to two primary receptors, AdipoR1 and AdipoR2, which are predominantly expressed in skeletal muscle and liver, respectively.3 Activation of these receptors stimulates the AMP-activated protein kinase (AMPK) and peroxisome proliferator-activated receptor alpha (PPAR-α) pathways, thereby enhancing glucose uptake and fatty acid oxidation in muscle tissue while concurrently reducing hepatic gluconeogenesis.4 This dual mechanism is essential for maintaining glucose equilibrium and improving insulin sensitivity. In addition, adiponectin exerts anti-inflammatory effects by downregulating pro-inflammatory cytokines, including interleukin-6 (IL-6) and tumor necrosis factor-alpha (TNF-α), thus mitigating the inflammatory milieu commonly associated with insulin resistance.5
Recent investigations have documented a significant inverse association between circulating adiponectin levels and insulin resistance in both pregnant and non-pregnant populations. For instance, Begum M, et al. have reported diminished adiponectin concentrations in women with GDM compared to normoglycemic controls,5 a finding that has been corroborated by Moyce Gruber BL and Dolinsky VW, who observed a similar trend alongside elevated HOMA-IR values in GDM patients.6 These findings imply that decreased adiponectin may serve not only as a marker of metabolic dysfunction but also as a contributing factor in the pathophysiology of GDM through impaired insulin signaling.
Despite these advances, the precise role of adiponectin in the metabolic disturbances observed during gestation remains incompletely elucidated. Specifically, the interplay among adiponectin, insulin resistance markers, and glucose homeostasis during pregnancy has not been fully delineated, and discrepancies persist regarding the magnitude of these associations.7 Moreover, research evaluating the diagnostic performance of adiponectin as a biomarker for GDM—particularly in conjunction with traditional measures such as fasting insulin, the oral glucose tolerance test (OGTT), and the HOMA-IR index—remains limited.
Despite extensive previous research, key gaps remain regarding the variation of adiponectin levels with gestational age and body mass index (BMI) in GDM, as well as the underlying mechanisms linking adiponectin to insulin resistance. In view of these gaps, the present study aims to provide a comprehensive evaluation of adiponectin and its association with key glycemic parameters in pregnant women with GDM compared to normoglycemic controls. By examining these relationships across different gestational ages and body mass index (BMI) categories, this investigation seeks to elucidate the role of adiponectin in the development of insulin resistance during pregnancy. This study reinforces the potential diagnostic utility of adiponectin and explores its mechanistic implications in GDM pathogenesis, thereby contributing novel insights that may inform future therapeutic strategies. Ultimately, this research endeavors to enhance the understanding of the metabolic alterations underlying GDM and to advance the identification of reliable biomarkers for early detection and risk stratification, with the goal of improving clinical outcomes for mothers and their children.
2. METHODOLOGY
2.1. Study Design and Ethical Considerations
A cross-sectional study was conducted between September 10, 2024, and February 10, 2025, at Al-Najaf Al-Ashraf Teaching Hospital, Al-Hakim General Hospital, and the Al-Mishkhab Primary Healthcare Sector in Najaf City, Iraq. The study protocol received approval from the Institutional Review Board (IRB) of the Najaf Health Directorate, Training and Human Development Center (Approval No. 33652) and complied with the ethical standards outlined in the Declaration of Helsinki.8 Informed written consent was obtained from all participants prior to enrollment.
2.2. Participant Recruitment and Selection
Pregnant women aged 18 to 40 years, in their second trimester (gestational weeks 13–26), were recruited from obstetrics consultation clinics at Al-Najaf Al-Ashraf Teaching Hospital and Al-Hakim General Hospital in Najaf City, Iraq. GDM was diagnosed based on OGTT, fasting blood glucose (FBS), and glycated hemoglobin (HbA1c) levels, in accordance with the standard diagnostic criteria of the American Diabetes Association (2023).9 Women with pre-existing diabetes (Type 1 or Type 2), multiple pregnancies, chronic inflammatory or autoimmune diseases, or those receiving medications known to affect glucose metabolism were excluded. Normoglycemic pregnant women meeting the same inclusion criteria were recruited from the Al-Mishkhab Primary Healthcare Sector to serve as the control group.
2.3. Clinical Assessment and Anthropometry
A comprehensive clinical evaluation was performed for each participant. Height was measured to the nearest 0.1 cm using a calibrated stadiometer, and weight was determined using a digital weighing scale with participants wearing light clothing and no shoes. The body mass index (BMI) was calculated and classified as follows: normoweight (18.5–24.9 kg/m²), overweight (25.0–29.9 kg/m²), and obese (≥30.0 kg/m²).10 These BMI categories were utilized to examine the relationship between BMI and biomarker levels in both the GDM and control groups.
2.4. Sample Collection and Processing
Fasting venous blood samples were collected in the morning after an 8–12 hour overnight fast using standard venipuncture techniques. Blood was drawn into serum separator tubes and allowed to clot at room temperature for 30 min, after which the samples were centrifuged at 3,000 rpm for 10 minutes. The resulting serum was aliquoted and stored at –80°C until further analysis.
2.5. Biochemical Measurements
2.5.1. Glucose Measurement (FGT and OGTT):
FBS and post-OGTT plasma glucose levels were measured using the enzymatic glucose oxidase-peroxidase (GOD-POD) method. In this process, β-D-glucose is oxidized by glucose oxidase (GOD) to produce gluconic acid and hydrogen peroxide (H₂O₂). The hydrogen peroxide then reacts with phenol and 4-aminophenazone (4-AP) in the presence of peroxidase (POD), forming a red quinonimine dye, the intensity of which is proportional to the glucose concentration. Absorbance was measured at 505 nm.
The assay was conducted using a commercial glucose assay kit following the manufacturer’s protocol, ensuring accuracy and reliability. The reagent was stored at 2–8°C and used without additional preparation.
2.6.2. Fasting Insulin:
Serum fasting insulin levels were measured using an ELISA kit (BT Lab; Cat. No. E0010Hu) with a detection range of 1.56–100 μIU/mL and a sensitivity of 0.938 μIU/mL. Absorbance was read at 450 nm using a Para Medical microplate reader, and concentrations were determined from a standard curve.
2.5.3. Adiponectin:
Serum adiponectin levels were measured using a sandwich ELISA kit (BT Lab; Cat. No. E1550Hu) with a detection range of 0.2–60 mg/L and a sensitivity of 0.11 mg/L. Absorbance was measured at 450 nm, and assays followed the manufacturer’s protocols, with each sample analyzed in duplicate number.
2.5.4. Calculation of HOMA-IR:
insulin resistance was evaluated using the Homeostatic Model Assessment of Insulin Resistance (HOMA-IR) formula (11) as Following: Fasting Insulin (uU/ml×Fasting Glucose/405).
2.6. Statistical Analysis
Demographic characteristics and pregnancy outcomes were expressed as numbers and frequency distributions for categorical variables to compare between groups, the chi-squared test. Continuous variables expressed as mean ± standard division (SD) and independent t-test were performed for compare two groups, ANOVA with Tukey's post hoc test for compared three or more groups respectively. Linear regression models were conducted to estimate Standardized Coefficients Beta and t value of pregnancy with GDM and control. Pearson correlation between biomarkers and all studied parameters. Stratified analyses were performed according to Gestational age groups and pregnancy BMI. The predictive performance for GDM was evaluated by calculating the area under the receiver operating characteristic curve (ROC [AUC]) with cutoff point and 95% confidence interval. Analyses were carried out using SPSS software version 28 (IBM, UK). All P values are two-sided, and statistical significance was defined as P < 0.05 (Sullivan, 2022)
3. RESULTS
Table 1 demonstrates that the GDM group exhibited significantly elevated values for BMI, OGTT, FGT, and HOMA-IR compared to the control group (P < 0.001), while serum adiponectin levels were markedly reduced (3.94 ± 1.32 mg/L vs. 7.42 ± 2.05 mg/L). Although a slight yet statistically significant difference in gestational age was observed between the groups, the mean values were comparable; additionally, maternal age did not differ significantly (P = 0.48).
| Table 1: Demographic, clinical, and biochemical characteristics of GDM group vs. Control groupa | |||
| Variables | GDM Group
(n=45) |
Control Group (n=45) | P-value* |
| Age | 26.18 ± 4.99 | 25.52 ± 3.88 | 0.485 |
| BMI (kg/m^2) | 29.36 ± 3.3 | 26.2 ± 3.11 | < 0.001 |
| Gestational Age (Weeks) | 19.02 ± 4.14 | 18.46 ± 4.03 | 0.510 |
| F. Ins. (mU/L) | 7.89 ± 1.85 | 5.46 ± 1.35 | < 0.001 |
| OGTT (mg/dl) | 159.43 ± 15.89 | 81.45 ± 5.69 | < 0.001 |
| FGIR | 20.98 ± 3.74 | 15.95 ± 4.42 | < 0.001 |
| HOMA1-IR | 3.17 ± 1.03 | 1.09 ± 0.25 | < 0.001 |
| Adiponectin (mg/L) | 3.94 ± 1.32 | 7.67 ± 1.97 | < 0.001 |
| Data presented as mean ± SD; P < 0.05 considered statistically significant; *: independent samples t-test | |||
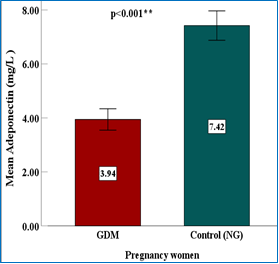 Figure 1: Comparison of serum adiponectin levels in GDM vs. Control groups |
Table 2 illustrates those pregnant women with GDM consistently demonstrate higher OGTT and HOMA-IR values and lower serum adiponectin levels compared to normoglycemic controls across all BMI categories (normoweight, overweight, and obese). Although maternal age and gestational age did not differ significantly between groups (P > 0.05), insulin resistance markers increased progressively with BMI, particularly among GDM participants. Moreover, adiponectin levels exhibited a clear inverse relationship with BMI, remaining significantly lower in the GDM group relative to controls.
| Table 2: Comparison of clinical and biochemical parameters among GDM and Control Groups, stratified by BMI a | |||||
| Parameter | BMI class | GDM Group | Control Group | ||
| Data | P-value | Data | P-value# | ||
| Age (yr) | Normoweight | 21 ± 0.82 | 0.082 NS | 25.33 ± 4.19 | 0.748 |
| Overweight | 26.4 ± 4.56 | 25.95 ± 3.56 | |||
| Obesity | 27.13 ± 5.6 | 24.71 ± 4.42 | |||
| BMI (kg/m2) | Normoweight | 24.36 ± 0.56 | 0.0001* | 23.38 ± 0.99 | < 0.001* |
| Overweight | 27.85 ± 1.27 | 26.85 ± 1.66 | |||
| Obesity | 32.97 ± 2.23 | 31.53 ± 1.48 | |||
| Gestational Age (Weeks) | Normoweight | 13.5 ± 1 | 0.0001* |
15.11 ± 1.45 | < 0.001* |
| Overweight | 17.84 ± 3.5 | 20.38 ± 3.75 | |||
| Obesity | 22.25 ± 2.98 | 21.29 ± 3.59 | |||
| F. Ins. (mIU/L) | Normoweight | 5.7 ± 0.55 | 0.0001* | 5.48 ± 1.44 | 0.480 |
| Overweight | 7.25 ± 1.65 | 5.62 ± 1.23 | |||
| Obesity | 9.42 ± 1.09 | 4.9 ± 1.5 | |||
| OGTT (mg/dl) | Normoweight | 140.73 ± 7.77 | 0.0001* | 80.33 ± 6.1 | 0.573 |
| Overweight | 155.69 ±14.74 | 82.13 ± 5.3 | |||
| Obesity | 169.94 ± 2.11 | 82.3 ± 6.14 | |||
| FGIR | Normoweight | 24.95 ± 3.72 | 0.0001* | 15.73 ± 4.52 | 0.386 |
| Overweight | 22.14 ± 3.58 | 15.43 ± 4.08 | |||
| Obesity | 18.17 ± 1.7 | 18.07 ± 5.17 | |||
| HOMA1-IR | Normoweight | 1.97 ± 0.11 | 0.0001* | 1.08 ± 0.27 | 0.417 |
| Overweight | 2.84 ± 0.94 | 1.13 ± 0.22 | |||
| Obesity | 3.97 ± 0.68 | 0.99 ± 0.29 | |||
| Adiponectin (mg/L) | Normoweight | 5.16 ± 1.24 | 0.0001* | 8.27 ± 1.78 | 0.264 |
| Overweight | 4.46 ± 1.2 | 7.3 ± 2.13 | |||
| Obesity | 2.84 ± 0.6 | 7.25 ± 1.83 | |||
| #: one-way ANOVA; *P < 0.05 considered as significant | |||||
Figure 2. ROC curve of serum adiponectin for GDM vs. control pregnant women.
Among GDM patients, fasting insulin (P < 0.001), OGTT (P = 0.0001), and HOMA-IR (P < 0.001) values increased significantly as gestational age advanced, while adiponectin levels decreased notably (P < 0.001). In contrast, the control group exhibited minimal changes in these insulin resistance markers over the same time intervals, with differences in fasting
in sulin (P = 0.159), HOMA-IR (P = 0.126), and adiponectin (P = 0.206) remaining statistically non-significant (Table 3).
| Table 3: Progressive changes in insulin resistance and adiponectin across gestational ages in GDM vs. Control Groupa | |||||
| Group
|
Parameter | Gestational age | P-value# | ||
| 13-16 weeks | 17-20 weeks | ≥ 21 weeks | |||
| GDM | F. Ins. (mIU/L) | 6.56 ± 0.86 | 7.66 ± 1.58 | 9.16 ± 1.77 | < 0.001 |
| OGTT (mg/dl) | 146.66 ± 9.86 | 165.82 ± 16.17 | 168.69 ± 12.47 | < 0.001 | |
| FGIR | 22.62 ± 2.76 | 22.27 ± 4.02 | 19.05 ± 3.65 | 0.005 | |
| HOMA1-IR | 2.39 ± 0.42 | 3.17 ± 0.89 | 3.87 ± 0.98 | < 0.001 | |
| Adiponectin (mg/L) | 5.01 ± 0.96 | 3.55 ± 0.95 | 3.12 ± 1.04 | < 0.001 | |
| Control | F. Ins. (mIU/L) | 5.58 ± 1.42 | 5.89 ± 1.38 | 4.91 ± 1.11 | 0.159 |
| OGTT (mg/dl) | 80.85 ± 5.73 | 79.53 ± 5.62 | 83.97 ± 5.16 | 0.113 | |
| FGIR | 15.52 ± 4.43 | 14.44 ± 4.5 | 17.86 ± 3.93 | 0.120 | |
| HOMA1-IR | 1.11 ± 0.27 | 1.15 ± 0.25 | 1.02 ± 0.22 | 0.366 | |
| Adiponectin (mg/L) | 8.15 ± 1.82 | 7.73 ± 1.79 | 6.93 ± 2.23 | 0.206 | |
| a Data presented as mean ± SD; #: one-way ANOVA; P < 0.05 considered as significant | |||||
| Table 4: Correlation of insulin resistance markers, adiponectin, and IL-6 in GDM vs. Control groupa | |||||||
| Biomarkers | F. Ins. (mIU/L) | OGTT (mg/dL) | FGIR | HOMA1-IR | Adipo- nectin (mg/L) |
||
| F. Ins. | r | 1 | 0.760** | -0.888** | 0.975** | -0.727** | GDM |
| P-value | 0.000 | 0.000 | 0.000 | 0.000 | |||
| OGTT | r | -0.385** | 1 | -0.399** | 0.875** | -0.625** | |
| P-value | 0.008 | 0.007 | 0.000 | 0.000 | |||
| FGIR | r | -0.962** | 0.557** | 1 | -0.773** | 0.597** | |
| P-value | 0.000 | 0.000 | 0.000 | 0.000 | |||
| HOMA1-IR | r | 0.956** | -0.105 | -0.867** | 1 | -0.727** | |
| P-value | 0.000 | 0.488 | 0.000 | 0.000 | |||
| Adiponectin | r | -0.102 | -0.052 | 0.069 | -0.123 | 1 | |
| P-value | 0.502 | 0.734 | 0.647 | 0.415 | |||
| Controls | |||||||
| a r: Correlation Coefficient | |||||||
| Table 5: Diagnostic performance of serum adiponectin in differentiating GDM from controlsa | ||||||
| Predictors | Area Under the Curve | |||||
| Area | Sig. | 95% CI | Cutoff | Sensitivity | Spe- cificity |
|
| Adiponectin (mg/L) | â 0.948 | 0.0001 | 0.906-0.991 | ≤5.4137 | 0.889 | 0.935 |
| a Sig: Significant; CI: Confidence Interval. | ||||||
underscore the role of elevated insulin levels in the suppression of adiponectin in GDM.
| Table 6: Multivariate regression analysis of glycemic markers associated with adiponectin in two groupsa | ||||
| Groups
|
Predictors
|
Dependent Variable: Adiponectin (mg/L) | ||
| Standardized Coefficients Beta | t | Sig. | ||
| GDM | OGTT (mg/dl) | -0.172 | -1.072 | 0.290 |
| F. Ins. (mIU/L) | -0.596 | -3.704 | <0.001* | |
| HOMA1-IR | -0.659 | -3.958 | <0.001* | |
| FGIR | 0.088 | 0.530 | 0.599 | |
| Control | OGTT (mg/dl) | -0.106 | -0.651 | 0.519 |
| F. Ins. (mIU/L) | -0.143 | -0.872 | 0.388 | |
| HOMA1-IR | -0.253 | -0.835 | 0.408 | |
| FGIR | -0.150 | -0.494 | 0.624 | |
| aSig: Significant; t: t-test; *: Indicate statistical significance at a P < 0.001. | ||||
4. DISCUSSION
The results of this study confirm that pregnant women with GDM exhibit markedly elevated insulin resistance indices, as evidenced by notably higher fasting insulin, OGTT, and HOMA-IR levels, alongside substantially lower adiponectin concentrations compared to normoglycemic controls. These metabolic disturbances intensify with advancing gestation, highlighting the progressive nature of insulin resistance in GDM. The strong inverse correlation between adiponectin and insulin resistance markers further underscores the critical role of this adipokine in glucose homeostasis during pregnancy. The findings of this study are consistent with several previous studies that have documented similar trends in adiponectin levels among women with GDM. For example, Cakina S, has reported considerably reduced adiponectin concentrations in GDM patients relative to controls, a finding that is consistent with the results observed in the current study.13 Likewise, Xie J and colleagues have demonstrated a significant increase in insulin resistance in GDM patients compared to normoglycemic pregnancies, echoing the pattern observed in this study.14
Further examination of the data stratified by BMI categories (normoweight, overweight, and obese) underscores the impact of adiposity on metabolic regulation. As shown in Table 2,
women with GDM in the overweight and obese groups exhibited markedly elevated insulin resistance markers (fasting insulin, OGTT, and HOMA-IR) compared to normal-weight counterparts, along with a notable reduction in adiponectin levels. These findings suggest that higher BMI exacerbates the metabolic disturbances characteristic of GDM, potentially due to an enhanced pro-inflammatory state and greater insulin resistance. This observation is consistent with Muntean M, et al. indicating that obesity amplifies the hormonal and inflammatory pathways implicated in gestational diabetes, thereby contributing to a more severe metabolic dysregulation.15
In the context of GDM, reduced adiponectin levels compromise the activation of the AMPK and PPAR-α pathways. This impairment leads to diminished glucose uptake, reduced fatty acid oxidation, and increased hepatic gluconeogenesis, all of which contribute to elevated insulin resistance. One plausible explanation for the observed reduction in adiponectin is the pro-inflammatory milieu characteristic of GDM.16 Excessive gestational weight gain or pre-existing obesity may
elevate levels of pro-inflammatory cytokines such as interleukin-6 (IL-6) and tumor necrosis factor-alpha
(TNF-α).17 These cytokines activate transcription factors, including nuclear factor-kappa B (NF-κB), which suppress adiponectin gene expression and diminish its insulin-sensitizing effects via the AMPK and PPAR-α pathways.18 Consequently, adiponectin deficiency exacerbates insulin resistance, perpetuating a vicious cycle of metabolic dysfunction.19
Furthermore, obesity, which is frequently associated with GDM, intensifies this dysregulation.20 Hypertrophied adipocytes in obese individuals secrete lower levels of adiponectin while releasing higher concentrations of inflammatory mediators.21 This imbalance further compromises adiponectin’s capacity to enhance insulin sensitivity, thereby contributing to hyperglycemia and the metabolic derangements characteristic of GDM. The progressive decline in adiponectin levels observed with advancing gestation may be attributed to the cumulative impact of these inflammatory and hormonal alterations.
Clinically, the diagnostic performance of serum adiponectin—as evidenced by the ROC analysis—suggests its potential as a valuable biomarker for early identification and risk stratification of GDM. Early detection is critical because it facilitates timely therapeutic interventions aimed at mitigating adverse perinatal outcomes. Building on previous research, this study offers a comprehensive evaluation of adiponectin in relation to multiple insulin resistance markers across various gestational ages and BMI categories. This approach reinforces the potential diagnostic utility of adiponectin and provides additional insights into its mechanistic role in GDM.
The strengths of this investigation include a well-characterized study population with BMI stratification, robust statistical analyses (including correlation and multivariate regression), and the application of ROC curves to assess diagnostic performance.
5. LIMITATIONS
The cross-sectional design precludes causal inferences regarding the temporal relationship between adiponectin and insulin resistance. Moreover, although efforts were made to control for potential confounding variables; residual confounding factors such as dietary habits, physical activity, and socio-economic status—may still affect the observed associations. Additionally, the sample of the study was drawn from a relatively homogenous population at a single center, introducing a possibility of selection bias that could limit the generalizability of the findings to broader or more diverse populations. Future longitudinal studies with more diverse populations and comprehensive control of confounders are warranted to further elucidate these associations. Additionally, interventional trials assessing the efficacy of adiponectin-enhancing therapies—whether lifestyle-based or pharmacological—are needed to explore potential strategies for reducing GDM-associated complications.
6. CONCLUSION
In summary, the study demonstrates that pregnant women with GDM exhibit significantly higher insulin resistance and lower serum adiponectin levels compared to the controls. These findings underscore the critical role of adiponectin, not only as a diagnostic biomarker, but also as a potential target for therapeutic intervention in GDM. By elucidating the inverse relationship between adiponectin and key metabolic markers (fasting insulin, OGTT, and HOMA-IR), the study provides novel insights into the metabolic dysregulation underlying GDM. This study advances our understanding beyond mere associations, suggesting that modulation of adiponectin pathways could contribute to improved clinical management and outcomes in gestational diabetes. While the cross-sectional design and homogeneous sample limit the generalizability of the findings, these results pave the way for future longitudinal investigations aimed at validating adiponectin's predictive value and exploring its mechanistic role in GDM progression.
7. Data availability
The numerical data generated during this research is available with the authors.
8. Conflict of interest
All authors declare that there was no conflict of interest.
9. Funding
The study utilized the hospital resources only, and no external or industry funding was involved.
10. Acknowledgments
We extend our sincere gratitude to all participants who volunteered for this study, as their contribution was essential to its success. Our heartfelt appreciation goes to the dedicated medical and nursing staff at Al-Najaf Al-Ashraf Teaching Hospital, Al-Hakim General Hospital, and Al-Mishkhab Primary Healthcare Sector in Najaf, Iraq, for their invaluable assistance in patient recruitment and sample collection.
11. Authors’ contribution
SHH: conducted the experiments, collected data, and performed statistical analysis.
AUH: conceptualized and designed the study
RDA: contributed to data interpretation and manuscript drafting.
All authors participated in manuscript revision, provided critical intellectual input, and approved the final version for submission.
12. REFERENCES
- Mora-Ortiz M, Rivas-García L. Gestational diabetes mellitus: unveiling maternal health dynamics from pregnancy through postpartum perspectives. Open Res Eur. 2024;4:164. PubMed DOI: 12688/openreseurope.18026.1
- Li Y, Onodera T, Scherer PE. Adiponectin. Trends Endocrinol Metab. 2024;35(7):674–5. PubMed DOI: 1016/j.tem.2024.05.004
- Baldelli S, Aiello G, Mansilla Di Martino E, Campaci D, Muthanna FMS, Lombardo M. The role of adipose tissue and nutrition in the regulation of adiponectin. Nutrients. 2024;16(15):2436. PubMed DOI: 3390/nu16152436
- Ahuja A, Zboinski E, Das S, Zhu X, Ma Q, Xie Y, et al. Antidiabetic features of AdipoAI, a novel AdipoR agonist. Cell Biochem Funct. 2024;42(1). PubMed DOI: 1002/cbf.3910
- Begum M, Choubey M, Tirumalasetty MB, Arbee S, Mohib MM, Wahiduzzaman M, et al. Adiponectin: a promising target for the treatment of diabetes and its complications. Life. 2023;13(11):2213. PubMed DOI: 3390/life13112213
- Moyce Gruber BL, Dolinsky VW. The role of adiponectin during pregnancy and gestational diabetes. Life. 2023;13(2):301. PubMed DOI: 3390/life13020301
- Downs T, da Silva Costa F, de Freitas Paganoti C, Holland OJ, Hryciw DH. Adiponectin and leptin during pregnancy: a systematic review of their association with pregnancy disorders, fetal growth and placental function. Endocrines. 2024;5(3):382–94. DOI: 3390/endocrines5030028
- World Medical Association. World Medical Association Declaration of Helsinki: ethical principles for medical research involving human subjects. JAMA. 2013;310(20):2191–4. PubMed DOI: 1001/jama.2013.281053
- Younas M, Ali A, Khan MQA, Shaheen S, Ishtiaq A, Roghani M. Glycated hemoglobin (HbA1c) in diagnosis of gestational diabetes mellitus. Pak J Pathol. 2024;35(1):1–6. DOI: 55629/pakjpathol.v35i1.805
- Inamdar A. Correlation of body mass index (BMI) with systolic and diastolic blood pressure in rural Indian patients. J Hypertens. 2024;42(Suppl 1):e227–8. DOI: 1097/01.hjh.0001021788.95421.3f
- Ogbodo EC, Onah CE, Amah AK, Okeke CS, Obiorah MO, Okezie AO, et al. Assessment of fasting plasma glucose, insulin, insulin resistance and glycated haemoglobin as markers of glycemic control in apparently healthy older adults in Nnewi. Indian J Forensic Community Med. 2024;11(2):49–55. DOI: 18231/j.ijfcm.2024.013
- Sullivan LM. Essentials of biostatistics for public health. Jones & Bartlett Learning; 2022.
- Cakina S, Ulu S, Beyazit F, Özen E, Postacı ES. Association between adiponectin and ADIPOQ (rs1501299) gene polymorphism in gestational diabetes mellitus patients. Rev Rom Med Lab. 2023;31(2):119–24. DOI: 2478/rrlm-2023-0010
- Xie J, Dai L, Tang X. Study on the correlation between the changes of TNFR1, TNF-α, and adiponectin in patients with gestational diabetes mellitus and insulin resistance. Eur J Inflamm. 2019;17. DOI: 1177/2058739219846346
- Muntean M, Săsăran V, Luca ST, Suciu LM, Nyulas V, Mărginean C. Serum levels of adipolin and adiponectin and their correlation with perinatal outcomes in gestational diabetes mellitus. J Clin Med. 2024;13(14):4082. PubMed DOI: 3390/jcm13144082
- Kotal S, Mukherjee P, Chakraborty D, Tewari S. A review on role of different adipokines in gestational diabetes. J Adv Zool. 2023;44(S6):2109–13. DOI: 17762/jaz.v44iS6.2794
- Vazquez L, Vazquez Arreola E, Looker HC, Hanson RL, Wasak D, Caballero R, et al. 1246-P: Maternal proinflammatory markers associate with obesity and glycemic measures in pregnancy. Diabetes. 2024;73(Suppl 1). DOI: 2337/db24-1246-P
- Kim JK. Endothelial nuclear factor κB in obesity and aging. Circulation. 2012;125(9):1081–3. PubMed DOI: 1161/CIRCULATIONAHA.111.090134
- Park JE, Han JS. Improving the effect of ferulic acid on inflammation and insulin resistance by regulating the JNK/ERK and NF-κB pathways in TNF-α-treated 3T3-L1 adipocytes. Nutrients. 2024;16(2):294. PubMed DOI: 3390/nu16020294
- Hadid Khalil A, Alassaf F, Abed M. Mechanisms and linkage of insulin signaling, resistance, and inflammation. Iraqi J Pharm. 2024;21(1):1–8. DOI: 33899/iphr.2023.144181.1065
- Bakinowska E, Krompiewski M, Boboryko D, Kiełbowski K, Pawlik A. The role of inflammatory mediators in the pathogenesis of obesity. Nutrients. 2024;16(17):2822. PubMed DOI: 3390/nu16172822