Pratika Pradeep Bhokare, Shalaka Nellore, Hemangi Karnik
Author affiliation:
Department of Anesthesiology, Lokmanya Tilak Municipal Medical College, Sion Murnbai-400022, India.
Correspondence: Dr. Pratika Pradeep Bhokare, 1103-Labh, Shubh-Labh Apartments, 90 Feet Road, Opp. Kelkar College, Mulund-(E), Mumbai, India, E-mail: pratika16691@gmail.com; Phone: +919820293359
Abstract
Background & Objectives: Neurosurgical operations involve major fluid shifts. Fluid management in such critical brain-injured patients is aimed at maintaining sufficient cerebral blood flow and oxygenation. Goal directed fluid strategies are beneficial in rationalization of the way the patients are treated. With availability of less invasive methods for monitoring, use of parameters like Stroke Volume Variation (SVV) and Pulse Pressure Variation (PPV) have been used to guide fluid management as these are more useful than central venous pressure (CVP) measurement. This study correlated an easily established monitoring technique like PPV with CVP for intra-operative fluid management in adult neurosurgical patients undergoing elective craniotomies.
Methodology: This prospective, observational study was carried out in 60 patients of either sex, age group 18 to 65 y, planned for elective craniotomies conducted in neurosurgical operation theatre. After anesthesia induction radial arterial cannulation was carried out to monitor the invasive arterial blood pressure and PPV (normal less than 13%). Central venous cannulation was carried out and transduced to measure the CVP.
Results: The sensitivity of CVP after calculating entirely was 5.0% and the specificity was 90%. The positive predictive value of CVP was 50.0% and the negative predictive value was a mere 32.14 %. The sensitivity of PPV was 50.0% and specificity was 32.14%. The positive predictive value was 5.00% and negative predictive value was 90%.
Conclusion: PPV is a reliable index of fluid management guidance in adult neurosurgical patients undergoing elective craniotomies as compared to CVP, which can lead to excessive administration of fluids.
Abbreviations: SVV – Stroke Volume Variation; PPV – Pulse Pressure Variation; CVP – Central venous pressure; VBG – Venous blood gas; HR – Heart Rate;
Keywords: Neurosurgery, fluid therapy, central venous pressure, arterial pressure, pulse pressure variation.
Citation: Bhokare PP, Nellore S, Karnik H. Correlation of pulse pressure variation with central venous pressure for intra–operative fluid management in adult neurosurgical patients. Anaesth. pain intensive care 2021;25(3):329–337. DOI: 10.35975/apic.v25i3.1483
Received: April 4, 2021; Reviewed: April 25, 2021; Accepted: May 15, 2021
Introduction
Neurosurgeries are perilous surgeries which have increased peri-operative mortality and morbidity.
Hemodynamic monitoring in these surgical patients is extremely crucial since these patients are prone to hypovolemia from insufficient fluid intake, osmotic diuretic therapy, physiological compensation for arterial hypertension and loss of blood.1
Fluid management in such critical brain-injured patients is aimed at maintaining sufficient cerebral blood flow and oxygenation while maintaining euvolemia, normal oncotic pressure and normal or slightly increased serum osmolarity.1,2 The fluids required vary from patient to patient and are difficult to foretell from traditional physiological parameters such as heart rate (HR), blood pressure (BP), and central venous pressure (CVP).3
Goal-directed fluid therapy is a term used to define the role of cardiac output, pulse pressure variation and stroke volume variation as a guide to intravenous fluid and ionotropic support. The classical parameters like HR, mean arterial pressure, diastolic blood pressure, CVP and urine output are not considered dependable in terms of goal-directed fluid therapy; as they change with surgical stress and anesthesia given.4 Advanced hemodynamic monitors like cardiac output monitors or pulse pressure devices are necessary for this purpose.5
There is tremendous amount of evidence that a given value of CVP does not predict fluid responsiveness. This has been established by a number of studies. The use of a static parameter like CVP for fluid resuscitation results in inconsistencies and is associated with variations resulting from intrathoracic structures and pulmonary vascular disorders.6 CVP measurements have been found to be unreliable with numerous errors while reading the value of CVP. However, CVP even though inaccurate and with limitations, should not be completely abandoned due to its use in non-ventilated patients and in places where technology for PPV measurements is unavailable.7
As a solution to deficiency of CVP, dynamic measurements like pulse pressure variation, stroke volume variation, systolic pressure variation, were developed. These have shown high specificity and sensitivity. PPV is attained by mechanical inspiration which generates cyclic alterations within cardiac preload which shows in left ventricular stroke volume and arterial pulse pressure.8 PPV has shown meticulous reactions to plasma volume expansion in patients on mechanical ventilator which trigger the same. The use of pulse pressure variation for intraoperative fluid therapy has shown improved outcomes and a reduced hospital stay.9
With availability of less invasive methods for monitoring, use of parameters like Stroke Volume Variation (SVV) and Pulse Pressure Variation (PPV) have been used increasingly to guide fluid management and have been shown to be more useful than CVP. PPV has been shown to be reflective of intravascular volume like systolic pressure variation in neurosurgical patients. Pulse Pressure Variation is a more reliable indicator of fluid responsiveness and management. PPV monitoring is cost effective and also prevents the complications associated with central line insertion.10
This study compared the efficiency of CVP and PPV in goal directed fluid management in neurosurgical patients undergoing craniotomies. It also aimed to find if PPV is superior to CVP for fluid resuscitation in the same surgical procedures.
Methodology
This prospective observational study was carried out in all patients fulfilling inclusion criteria during the study period with a minimum of 60 patients of either sex, age group 18 to 65 y, planned for major elective craniotomies in supine position, who were willing to participate in the study. Institutional Ethics Committee approval was obtained.
A sample size of 60 was calculated based on a similar study done in 2016 by Sundaram et al.11 in the neurosurgical patients using CVP and PPV guided goal directed fluid therapy. This was calculated for a 0.05% difference (two- sided) with a power of 80% for the primary outcome of mean arterial blood pressure.
Patients with known cardiac instability, patients on ionotropic support, with arrhythmias, peripheral vascular disease, pulmonary hypertension, patients in sepsis and those not consenting were excluded.
A routine pre-anesthetic evaluation was carried out by the anesthesiologist of the patients admitted in the neurosurgical ward one day prior to the surgery. On the morning of the surgery, the duration and adequacy of fasting, GCS, pre-operative intake of anti-epileptics, steroids, diuretics and antibiotics, site and size of the intracranial tumor on MRI was noted. A written valid informed consent was taken from the patients for their willingness to participate in the study.
Anesthesia was induced as per the standard anesthesia protocol followed in neurosurgery OT. After taking the patient on OT table, monitoring with pulse oximetry, 5-lead electrocardiography, non-invasive blood pressure and temperature was carried out. Post–induction, radial arterial cannulation was carried out to monitor the invasive arterial blood pressure and PPV (normal less than 13%). Central venous cannulation was carried out to measure the CVP.
Parameters like HR, MAP, urine output, SpO2, EtCO2 and temperature were recorded before induction; and after muscle relaxant administration which was considered as the baseline value. PPV and CVP were recorded after the muscle relaxant was administered (before intubation). The next reading of PPV and CVP was taken after intubation. After that readings were taken every 15 min for the first 1 hour of surgery and thereafter every 30 min till the end of the surgery. In addition, measurements were also noted pre and post mannitol 0.5 gm/kg administered prior to dural opening. Venous blood gas (VBG) samples were collected to attain the values of baseline and post skin closure ScvO2.
Intra-operative fluids were titrated to maintain CVP between 8-10 cmH2O on mechanical ventilation, MAP > 65 mmHg and HR within the range of +20% of baseline.
The fluid regimen followed was;
Step 1: Calculate preoperative starvation fluid [SF] - 2 × hours of starvation × weight
Step 2: Calculate the intra-operative maintenance fluid [MF]- 3 ml/kg/h (taking into consideration the surgical exposure)
Step 3: Adjust for the blood loss- 1st hour – 1⁄2 SF + MF; 2nd and 3rd hours - 1⁄4 SF + MF; 4th hour onwards – MF
If CVP was less than 8 cmH2O, the first bolus of Ringer’s lactate (RL) solution 5 ml/kg over 10 min was given. CVP, PPV, HR and MAP were noted. If the CVP remained less than 8 cm, then a second bolus of 5 ml/kg of RL was given over 10 min. Again CVP, PPV, HR and MAP were noted. After a total of 500 ml of crystalloids as fluid bolus; a third fluid bolus of 2 ml/kg of colloid was administered if CVP continued to be < 8 cmH2O. Again CVP, PPV, HR and MAP were noted. When the target CVP of less than 8 cmH2O was achieved, normal maintenance fluids were resumed. If CVP continued to remain low along with tachycardia or MAP < 65mmHg, then blood loss was reassessed. If it was measured to be beyond the maximum allowable blood loss (MABL), then colloids or blood transfusion was considered.
Persistent hypotension despite normal or high CVP was treated with a vasopressor viz. phenylephrine 50 µg or ephedrine 5 mg boluses or inotropes as per the discretion of case anesthetist. Final PPV and CVP readings for each patient were taken before discontinuing mechanical ventilation. The total estimated blood loss, urine output and fluid intake were noted at the end of surgery.
Statistical analysis: SPSS Version 20 was used for statistical analysis of the data in this study.
Results
Table 1 shows the gender and the American Society of Anesthesiologists (ASA) physical status classification system of the patients.
.
Table 2 shows the range and the mean values of the age of the study patients, weight, the height, hours of starvation (HOS), and Hb of the patients. The starvation and maintenance fluids were calculated in order to guide fluid therapy, and the range and the mean volumes infused are given in Table 2.
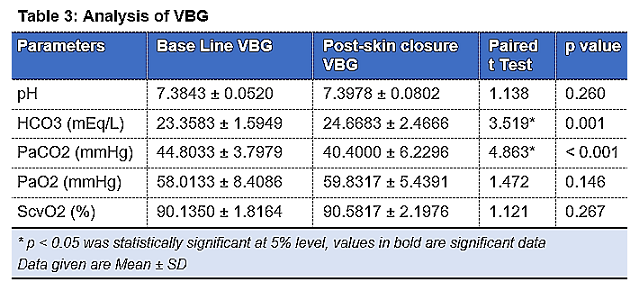
In Table 3, Baseline VBG shows a mean ScvO2 value of 90.1350 +/- 1.8164 %; post – skin closure mean ScvO2 value is 90.5817 +/- 2.1976%. Paired T test was
.
.
carried out to compare the two sets of values of ScvO2 and p value is calculated. p value is 0.267 indicating that there is no significant difference between the baseline and post skin closure values of ScvO2. This shows tissue perfusion is maintained within normal limits.
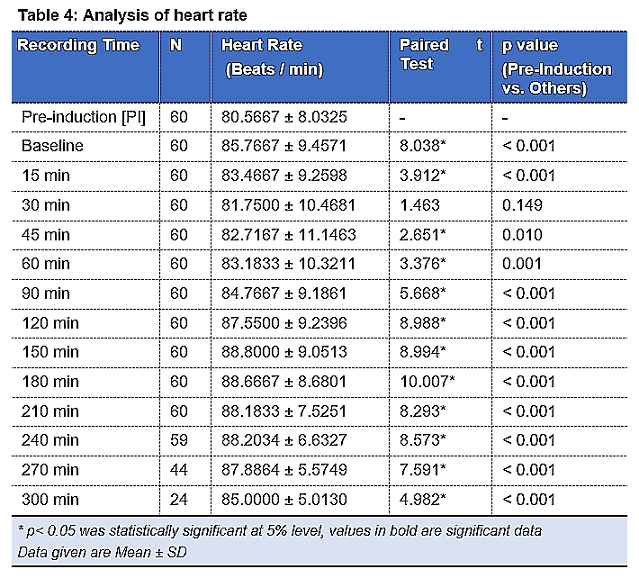
Table 4 shows that pre-induction mean HR was 80.5667±8.0325 per min. After induction and after giving mannitol prior to dura opening (45-60 min post induction), the mean HR showed a statistically highly significant rise (p < 0.001, p < 0.05).
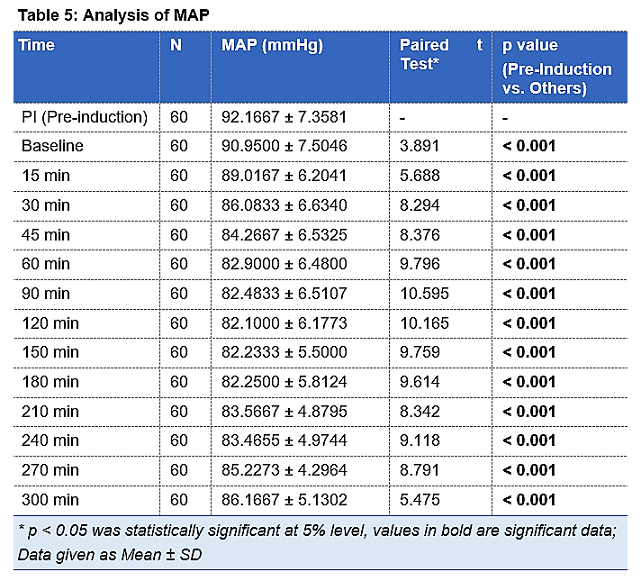
Table 5 shows that pre-induction mean MAP was 92.1667±7.3581 mm Hg. After induction and after giving mannitol prior to dura opening (45-60 min post induction), the mean MAP showed a statistically highly significant fall (p < 0.001) as compared to the pre-induction value.
ScvO2 was used as a perfusion indicator to check the tissue perfusion in patients. Baseline VBG show a mean ScvO2 value of 90.1350 ± 1.8164 %; post-skin closure mean ScvO2 value is 90.5817 ± 2.1976%. Paired t-test was carried out to compare the two sets of values of ScvO2 and p value is calculated. p value is 0.267 indicating that there is no significant difference between the baseline and post skin closure values of ScvO2. This shows tissue perfusion is maintained within normal limits.
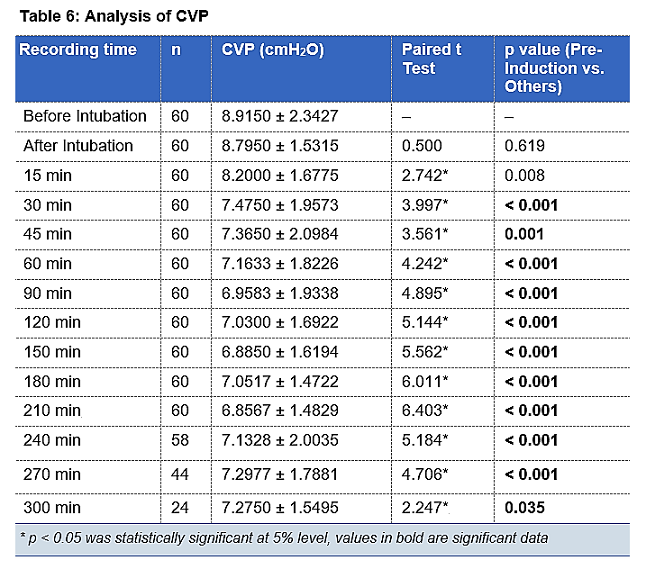
Table 6 shows that the CVP data. After intubation and after giving mannitol prior to dura opening (45–60 min post induction), the mean CVP showed a statistically highly significant fall (p < 0.001) as compared to the value before intubation.
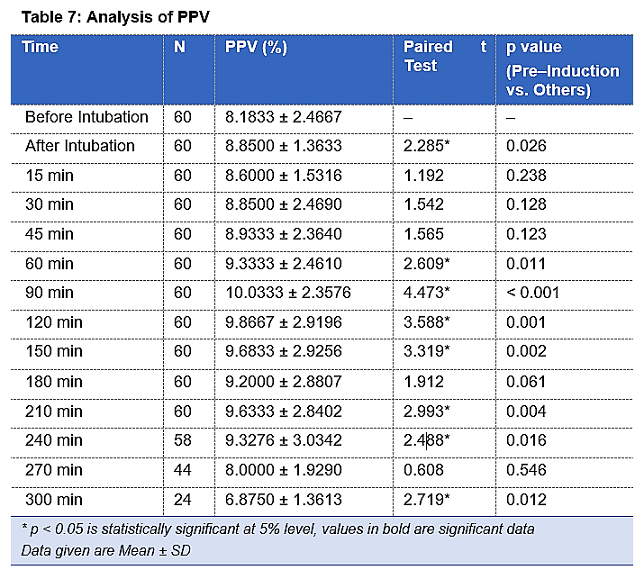
Table 7 shows the baseline mean values of PPV. After intubation and after giving mannitol prior to dura opening, the mean PPV showed a statistically significant fall (p < 0.05) but the value of PPV remained below the normal cut off of 13%. Fluid bolus was administered when the CVP dropped below 8 cmH2O and simultaneous PPV was also measured. After mannitol administration was the PPV showed statistically significant rise (p< 0.001) in patients The PPV value has shown variations but has stayed within normal range. pening, the mean PPV showed a statistically significant fall (p < 0.05) but the value of PPV remained below the normal cut off of 13%. Fluid bolus was administered when the CVP dropped below 8 cmH2O and simultaneous PPV was also measured. After mannitol administration was the PPV showed statistically significant rise (p< 0.001) in patients The PPV value has shown variations but has stayed within normal range.
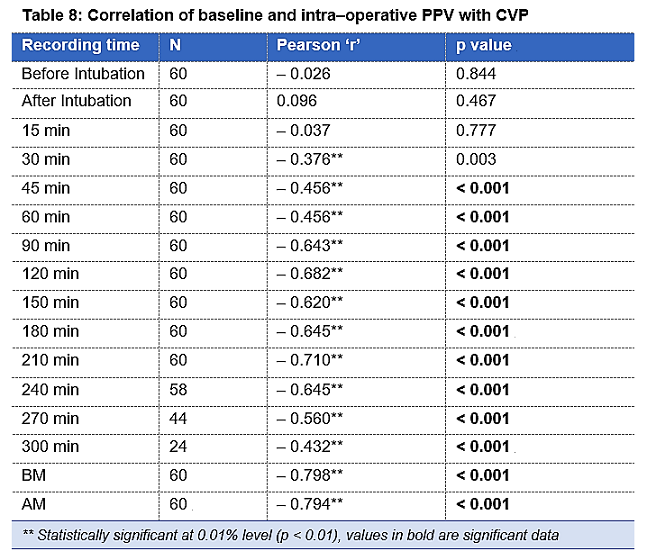
Table 8 shows the correlation between CVP and PPV during the entire intra–operative period. This relationship between CVP and PPV is statistically highly significant throughout the intra–operative period. Also, it shows distinctly the association between CVP and PPV before and after mannitol administration which is statistically highly significant. The Pearsons’s correlation which measures the linear dependence between two variables (CVP and PPV) is between –1 and +1. p value is statistically significant with p < 0.001. The sensitivity of PV after calculation is 50% with a 95% Confidence Interval of 6.76– 93.24. The specificity of PPV was 32.14% with a confidence interval of 20.29–45.96. The positive predictive value of PPV was 5% with a 95% confidence interval of 1.91 to 12.48. The negative predictive value of PPV was 90% with a 95% confidence interval of 75.88 to 96.26.
The sensitivity, specificity, the positive predictive value, and the negative predictive value of PPV are shown in Table 10. Correlation between PPV Vs CVP i.e. the Pearson’s correlation coefficient is –0.334*, p=0.009, is negatively correlated and statistically highly significant (p < 0.01).
Discussion
Neurosurgeries are high-risk surgeries that require stable hemodynamics and metabolic state. The vulnerable deviations in intracranial volume and pressure, cerebral blood flow and metabolism ask for intricate monitoring and precise anesthesia administration. There can be a fall of the CVP following pre–medication and induction of of anesthesia.11 The CVP values may demonstrate a fall associated with hypotension following blood loss or diuretic therapy. A drop in CVP, albeit borderline, was also noted in our study, with the infusion of mannitol. The lowest mean value of CVP
.
failed to decline below mean value of 6.8 cmH2O as fluid resuscitation was adequately managed with fluid bolus when CVP fell below 8 cmH2O. PPV, a dynamic index of fluid status was monitored along with HR, MAP and CVP. The deviations in PPV values within normal range showed statistical significance (p < 0.001); However, the fluctuations remained within the cut off value of 13% of the normal PPV values.
The value of Pearson’s correlation coefficient ‘r’ was seen to remain between –1 to +1, thus, showing a reliable correlation between the two variables (CVP and PPV). PPV and CVP showed a strong negative correlation throughout the intra–operative period which means that decrease in CVP has correlated with the increase in the PPV throughout the surgery which is expected considering the normal range and function of values for these two parameters. The p value has stayed < 0.01 making it clinically significant after 30 min of the surgery. In our study we observed that whenever CVP decreased, PPV value did rise but most of the increased values of PPV still remained within the normal range of 13%. In a study conducted by Sundaram et al,11 intra–operative fluid management was done in patients undergoing intracranial tumor surgeries with the guidance of CVP and PPV. PPV versus CVP was also compared in another study by Hussein et al.12 in patients schedules for major abdominal operations. They concluded that CVP guided fluid management led to inaccurate fluid replacement. PPV when combined with CVP was a better predictor of fluid requirement instead of a single
.
index. Grassi et al.10 conducted an observational study to evaluate the credibility of Pulse Pressure Variation as a foreteller of fluid responsiveness in mechanically ventilated patients. The conclusion tilted in favor of PPV as a guide for fluid therapy. In our study we used CVP for goal directed therapy and titrated fluids only as per the CVP values. When PPV was correlated with changes in CVP, we observed that PPV values didn’t reflect fluid deficient status by the patients.
Fluid boluses were administered whenever CVP value decreased below 8 cmH2O and at the same time PPV values were noted. The response of the two variable parameters to fluid bolus were recorded. The mean values along with standard deviations were calculated and statistical significance was found out. It was found that the mean CVP values after first fluid bolus was 6.5662 ± 1.8164 cmH2O, after second fluid bolus was 8.4000 ±1.1547 cmH2O and was 8.6471 ± 0.9963 cmH2O after third fluid bolus. Third fluid bolus was required on 17 occasions as per the CVP values. Whenever the mean CVP values showed fluid deficit post three fluid boluses, blood transfusion was considered for the patient. The p value was < 0.001 throughout and demonstrated a statistical significance. In a similar pattern, PPV values were recorded pre and post fluid bolus administration. The mean PPV values with standard deviations after first fluid bolus was 11.8897±1.9802%, after second fluid bolus was 10.00 ± 2.1794% and 9.0588 ± 2.3311% post third fluid bolus which was given on 17 occasions as per CVP values. p value remained < 0.001 throughout this period making it statistically significant. The mean PPV values manifested a fluid– sufficient status at values of CVP which revealed fluid deficit status.
Blood loss was associated with hypotension and decreased CVP and increased PPV values. Mannitol administration increased urine output and affected the MAP and at times the CVP and PPV. The average volume of fluids given to patients was 2575 ± 326.3767 ml. Goal directed fluid therapy on the basis of CVP was administered. None of the patients required vasopressors or inotropes.
The sensitivity of CVP after calculating entirely was 5% and the specificity was 90%. The positive predictive value of CVP was 50% and the negative predictive value was a mere 32.14%. The sensitivity of PPV was 50% and specificity was 32.14%. The positive predictive value was 5% and negative predictive value was 90%.13
The sensitivity of PPV was high compared to CVP, which proves that the probability of PPV measurement identifying an individual with volume deficit is extremely high. Thus, PPV is actually more effective for finding patients which require fluid and guide us while giving fluid bolus. As CVP has higher specificity as compared to PPV, it will not fail to identify patients who do not have fluid deficit. However, an individual CVP value alone will fail to recognize most of the individuals with fluid deficit and thus, is not a good guiding measure to administer fluid bolus. PPV measurements have demonstrated high negative predictive value and thus, it will successfully identify patients who are not in need of a fluid bolus and are adequately hydrated and perfused.
Thus, from the statistics and values of the hemodynamic parameters, PPV may seem to be a better predictor of fluid responsiveness and can be used in goal directed fluid management. However, the sensitivity of PPV is less compared to CVP and thus an allied aid of the static index i.e. CVP will result in better monitoring and management of fluid status of a patient which will eventually lead to hemodynamic stability during intra–operative period of major surgeries. As per our observation, no single parameter can be used independently to assess fluid responsiveness but instead a combination of static and dynamic variables may provide a more suitable option for fluid therapy in neurosurgical patients.
Conclusion
The results of our study conclude that pulse pressure variation is a reliable index of fluid management guidance in neurosurgical patients, while central venous pressure is a poor index which can lead to fluids overload in the patients. Simultaneous monitoring of the both parameters is a better guide for fluid management in neurosurgical patients undergoing craniotomies.
Conflict of Interest
None to declare
Authors’ contribution
PB: Primary author, data collection, manuscript writing
SN: Concept, methodology, editing
HK: Concept, supervision
References
Author affiliation:
Department of Anesthesiology, Lokmanya Tilak Municipal Medical College, Sion Murnbai-400022, India.
Correspondence: Dr. Pratika Pradeep Bhokare, 1103-Labh, Shubh-Labh Apartments, 90 Feet Road, Opp. Kelkar College, Mulund-(E), Mumbai, India, E-mail: pratika16691@gmail.com; Phone: +919820293359
Abstract
Background & Objectives: Neurosurgical operations involve major fluid shifts. Fluid management in such critical brain-injured patients is aimed at maintaining sufficient cerebral blood flow and oxygenation. Goal directed fluid strategies are beneficial in rationalization of the way the patients are treated. With availability of less invasive methods for monitoring, use of parameters like Stroke Volume Variation (SVV) and Pulse Pressure Variation (PPV) have been used to guide fluid management as these are more useful than central venous pressure (CVP) measurement. This study correlated an easily established monitoring technique like PPV with CVP for intra-operative fluid management in adult neurosurgical patients undergoing elective craniotomies.
Methodology: This prospective, observational study was carried out in 60 patients of either sex, age group 18 to 65 y, planned for elective craniotomies conducted in neurosurgical operation theatre. After anesthesia induction radial arterial cannulation was carried out to monitor the invasive arterial blood pressure and PPV (normal less than 13%). Central venous cannulation was carried out and transduced to measure the CVP.
Results: The sensitivity of CVP after calculating entirely was 5.0% and the specificity was 90%. The positive predictive value of CVP was 50.0% and the negative predictive value was a mere 32.14 %. The sensitivity of PPV was 50.0% and specificity was 32.14%. The positive predictive value was 5.00% and negative predictive value was 90%.
Conclusion: PPV is a reliable index of fluid management guidance in adult neurosurgical patients undergoing elective craniotomies as compared to CVP, which can lead to excessive administration of fluids.
Abbreviations: SVV – Stroke Volume Variation; PPV – Pulse Pressure Variation; CVP – Central venous pressure; VBG – Venous blood gas; HR – Heart Rate;
Keywords: Neurosurgery, fluid therapy, central venous pressure, arterial pressure, pulse pressure variation.
Citation: Bhokare PP, Nellore S, Karnik H. Correlation of pulse pressure variation with central venous pressure for intra–operative fluid management in adult neurosurgical patients. Anaesth. pain intensive care 2021;25(3):329–337. DOI: 10.35975/apic.v25i3.1483
Received: April 4, 2021; Reviewed: April 25, 2021; Accepted: May 15, 2021
Introduction
Neurosurgeries are perilous surgeries which have increased peri-operative mortality and morbidity.
Hemodynamic monitoring in these surgical patients is extremely crucial since these patients are prone to hypovolemia from insufficient fluid intake, osmotic diuretic therapy, physiological compensation for arterial hypertension and loss of blood.1
Fluid management in such critical brain-injured patients is aimed at maintaining sufficient cerebral blood flow and oxygenation while maintaining euvolemia, normal oncotic pressure and normal or slightly increased serum osmolarity.1,2 The fluids required vary from patient to patient and are difficult to foretell from traditional physiological parameters such as heart rate (HR), blood pressure (BP), and central venous pressure (CVP).3
Goal-directed fluid therapy is a term used to define the role of cardiac output, pulse pressure variation and stroke volume variation as a guide to intravenous fluid and ionotropic support. The classical parameters like HR, mean arterial pressure, diastolic blood pressure, CVP and urine output are not considered dependable in terms of goal-directed fluid therapy; as they change with surgical stress and anesthesia given.4 Advanced hemodynamic monitors like cardiac output monitors or pulse pressure devices are necessary for this purpose.5
There is tremendous amount of evidence that a given value of CVP does not predict fluid responsiveness. This has been established by a number of studies. The use of a static parameter like CVP for fluid resuscitation results in inconsistencies and is associated with variations resulting from intrathoracic structures and pulmonary vascular disorders.6 CVP measurements have been found to be unreliable with numerous errors while reading the value of CVP. However, CVP even though inaccurate and with limitations, should not be completely abandoned due to its use in non-ventilated patients and in places where technology for PPV measurements is unavailable.7
As a solution to deficiency of CVP, dynamic measurements like pulse pressure variation, stroke volume variation, systolic pressure variation, were developed. These have shown high specificity and sensitivity. PPV is attained by mechanical inspiration which generates cyclic alterations within cardiac preload which shows in left ventricular stroke volume and arterial pulse pressure.8 PPV has shown meticulous reactions to plasma volume expansion in patients on mechanical ventilator which trigger the same. The use of pulse pressure variation for intraoperative fluid therapy has shown improved outcomes and a reduced hospital stay.9
With availability of less invasive methods for monitoring, use of parameters like Stroke Volume Variation (SVV) and Pulse Pressure Variation (PPV) have been used increasingly to guide fluid management and have been shown to be more useful than CVP. PPV has been shown to be reflective of intravascular volume like systolic pressure variation in neurosurgical patients. Pulse Pressure Variation is a more reliable indicator of fluid responsiveness and management. PPV monitoring is cost effective and also prevents the complications associated with central line insertion.10
This study compared the efficiency of CVP and PPV in goal directed fluid management in neurosurgical patients undergoing craniotomies. It also aimed to find if PPV is superior to CVP for fluid resuscitation in the same surgical procedures.
Methodology
This prospective observational study was carried out in all patients fulfilling inclusion criteria during the study period with a minimum of 60 patients of either sex, age group 18 to 65 y, planned for major elective craniotomies in supine position, who were willing to participate in the study. Institutional Ethics Committee approval was obtained.
A sample size of 60 was calculated based on a similar study done in 2016 by Sundaram et al.11 in the neurosurgical patients using CVP and PPV guided goal directed fluid therapy. This was calculated for a 0.05% difference (two- sided) with a power of 80% for the primary outcome of mean arterial blood pressure.
Patients with known cardiac instability, patients on ionotropic support, with arrhythmias, peripheral vascular disease, pulmonary hypertension, patients in sepsis and those not consenting were excluded.
A routine pre-anesthetic evaluation was carried out by the anesthesiologist of the patients admitted in the neurosurgical ward one day prior to the surgery. On the morning of the surgery, the duration and adequacy of fasting, GCS, pre-operative intake of anti-epileptics, steroids, diuretics and antibiotics, site and size of the intracranial tumor on MRI was noted. A written valid informed consent was taken from the patients for their willingness to participate in the study.
Anesthesia was induced as per the standard anesthesia protocol followed in neurosurgery OT. After taking the patient on OT table, monitoring with pulse oximetry, 5-lead electrocardiography, non-invasive blood pressure and temperature was carried out. Post–induction, radial arterial cannulation was carried out to monitor the invasive arterial blood pressure and PPV (normal less than 13%). Central venous cannulation was carried out to measure the CVP.
Parameters like HR, MAP, urine output, SpO2, EtCO2 and temperature were recorded before induction; and after muscle relaxant administration which was considered as the baseline value. PPV and CVP were recorded after the muscle relaxant was administered (before intubation). The next reading of PPV and CVP was taken after intubation. After that readings were taken every 15 min for the first 1 hour of surgery and thereafter every 30 min till the end of the surgery. In addition, measurements were also noted pre and post mannitol 0.5 gm/kg administered prior to dural opening. Venous blood gas (VBG) samples were collected to attain the values of baseline and post skin closure ScvO2.
Intra-operative fluids were titrated to maintain CVP between 8-10 cmH2O on mechanical ventilation, MAP > 65 mmHg and HR within the range of +20% of baseline.
The fluid regimen followed was;
Step 1: Calculate preoperative starvation fluid [SF] - 2 × hours of starvation × weight
Step 2: Calculate the intra-operative maintenance fluid [MF]- 3 ml/kg/h (taking into consideration the surgical exposure)
Step 3: Adjust for the blood loss- 1st hour – 1⁄2 SF + MF; 2nd and 3rd hours - 1⁄4 SF + MF; 4th hour onwards – MF
If CVP was less than 8 cmH2O, the first bolus of Ringer’s lactate (RL) solution 5 ml/kg over 10 min was given. CVP, PPV, HR and MAP were noted. If the CVP remained less than 8 cm, then a second bolus of 5 ml/kg of RL was given over 10 min. Again CVP, PPV, HR and MAP were noted. After a total of 500 ml of crystalloids as fluid bolus; a third fluid bolus of 2 ml/kg of colloid was administered if CVP continued to be < 8 cmH2O. Again CVP, PPV, HR and MAP were noted. When the target CVP of less than 8 cmH2O was achieved, normal maintenance fluids were resumed. If CVP continued to remain low along with tachycardia or MAP < 65mmHg, then blood loss was reassessed. If it was measured to be beyond the maximum allowable blood loss (MABL), then colloids or blood transfusion was considered.
Persistent hypotension despite normal or high CVP was treated with a vasopressor viz. phenylephrine 50 µg or ephedrine 5 mg boluses or inotropes as per the discretion of case anesthetist. Final PPV and CVP readings for each patient were taken before discontinuing mechanical ventilation. The total estimated blood loss, urine output and fluid intake were noted at the end of surgery.
Statistical analysis: SPSS Version 20 was used for statistical analysis of the data in this study.
Results
Table 1 shows the gender and the American Society of Anesthesiologists (ASA) physical status classification system of the patients.
| Table 1: Gender and ASA status of patients | |
| Parameter | Patients n (%) |
| Sex | |
| Female | 23 (38) |
| Male | 37 (62) |
| ASA | |
| I | 39 (65) |
| II | 17 (28) |
| III | 4 (7) |
| IV | 0 (0) |
| Total | 60 (100) |
Table 2 shows the range and the mean values of the age of the study patients, weight, the height, hours of starvation (HOS), and Hb of the patients. The starvation and maintenance fluids were calculated in order to guide fluid therapy, and the range and the mean volumes infused are given in Table 2.
In Table 3, Baseline VBG shows a mean ScvO2 value of 90.1350 +/- 1.8164 %; post – skin closure mean ScvO2 value is 90.5817 +/- 2.1976%. Paired T test was
| Table 2: Descriptive statistics of the vital parameters | ||
| Parameters | Parameters | Parameters |
| Age (y) | 18 - 65 | 41.8167 ± 13.9278 |
| Weight (kg) | 45 - 80 | 60.97 ± 8.09 |
| Height (cm) | 146 - 170 | 157.12 ± 6.16 |
| HOS (h) | 8.00 - 12.00 | 9.9167 ± 1.4647 |
| SF (ml) | 800.00 - 2104.00 | 1231.3000 ± 272.7469 |
| MF (ml) | 100.00 - 325.00 | 215.4833 ± 47.4150 |
.
carried out to compare the two sets of values of ScvO2 and p value is calculated. p value is 0.267 indicating that there is no significant difference between the baseline and post skin closure values of ScvO2. This shows tissue perfusion is maintained within normal limits.
Table 4 shows that pre-induction mean HR was 80.5667±8.0325 per min. After induction and after giving mannitol prior to dura opening (45-60 min post induction), the mean HR showed a statistically highly significant rise (p < 0.001, p < 0.05).
Table 5 shows that pre-induction mean MAP was 92.1667±7.3581 mm Hg. After induction and after giving mannitol prior to dura opening (45-60 min post induction), the mean MAP showed a statistically highly significant fall (p < 0.001) as compared to the pre-induction value.
ScvO2 was used as a perfusion indicator to check the tissue perfusion in patients. Baseline VBG show a mean ScvO2 value of 90.1350 ± 1.8164 %; post-skin closure mean ScvO2 value is 90.5817 ± 2.1976%. Paired t-test was carried out to compare the two sets of values of ScvO2 and p value is calculated. p value is 0.267 indicating that there is no significant difference between the baseline and post skin closure values of ScvO2. This shows tissue perfusion is maintained within normal limits.
Table 6 shows that the CVP data. After intubation and after giving mannitol prior to dura opening (45–60 min post induction), the mean CVP showed a statistically highly significant fall (p < 0.001) as compared to the value before intubation.
Table 7 shows the baseline mean values of PPV. After intubation and after giving mannitol prior to dura opening, the mean PPV showed a statistically significant fall (p < 0.05) but the value of PPV remained below the normal cut off of 13%. Fluid bolus was administered when the CVP dropped below 8 cmH2O and simultaneous PPV was also measured. After mannitol administration was the PPV showed statistically significant rise (p< 0.001) in patients The PPV value has shown variations but has stayed within normal range. pening, the mean PPV showed a statistically significant fall (p < 0.05) but the value of PPV remained below the normal cut off of 13%. Fluid bolus was administered when the CVP dropped below 8 cmH2O and simultaneous PPV was also measured. After mannitol administration was the PPV showed statistically significant rise (p< 0.001) in patients The PPV value has shown variations but has stayed within normal range.
Table 8 shows the correlation between CVP and PPV during the entire intra–operative period. This relationship between CVP and PPV is statistically highly significant throughout the intra–operative period. Also, it shows distinctly the association between CVP and PPV before and after mannitol administration which is statistically highly significant. The Pearsons’s correlation which measures the linear dependence between two variables (CVP and PPV) is between –1 and +1. p value is statistically significant with p < 0.001. The sensitivity of PV after calculation is 50% with a 95% Confidence Interval of 6.76– 93.24. The specificity of PPV was 32.14% with a confidence interval of 20.29–45.96. The positive predictive value of PPV was 5% with a 95% confidence interval of 1.91 to 12.48. The negative predictive value of PPV was 90% with a 95% confidence interval of 75.88 to 96.26.
The sensitivity, specificity, the positive predictive value, and the negative predictive value of PPV are shown in Table 10. Correlation between PPV Vs CVP i.e. the Pearson’s correlation coefficient is –0.334*, p=0.009, is negatively correlated and statistically highly significant (p < 0.01).
Discussion
Neurosurgeries are high-risk surgeries that require stable hemodynamics and metabolic state. The vulnerable deviations in intracranial volume and pressure, cerebral blood flow and metabolism ask for intricate monitoring and precise anesthesia administration. There can be a fall of the CVP following pre–medication and induction of of anesthesia.11 The CVP values may demonstrate a fall associated with hypotension following blood loss or diuretic therapy. A drop in CVP, albeit borderline, was also noted in our study, with the infusion of mannitol. The lowest mean value of CVP
| Table 9: Sensitivity, specificity, negative and positive predictive values of PPV | |||
| After CVP | PPV | Total | |
| Abnormal | Normal | ||
| Abnormal | 2 | 38 | 40 |
| Normal | 2 | 18 | 20 |
| Total | 4 | 56 | 60 |
| PPV | Value | 95% CI | |
| Sensitivity | 50.0% | 6.76 to 93.24 | |
| Specificity | 32.14% | 20.29 to 45.96 | |
| Positive Predictive Value | 5.00% | 1.91 to 12.48 | |
| NPV* | 90.0% | 75.88 to 96.26 | |
failed to decline below mean value of 6.8 cmH2O as fluid resuscitation was adequately managed with fluid bolus when CVP fell below 8 cmH2O. PPV, a dynamic index of fluid status was monitored along with HR, MAP and CVP. The deviations in PPV values within normal range showed statistical significance (p < 0.001); However, the fluctuations remained within the cut off value of 13% of the normal PPV values.
The value of Pearson’s correlation coefficient ‘r’ was seen to remain between –1 to +1, thus, showing a reliable correlation between the two variables (CVP and PPV). PPV and CVP showed a strong negative correlation throughout the intra–operative period which means that decrease in CVP has correlated with the increase in the PPV throughout the surgery which is expected considering the normal range and function of values for these two parameters. The p value has stayed < 0.01 making it clinically significant after 30 min of the surgery. In our study we observed that whenever CVP decreased, PPV value did rise but most of the increased values of PPV still remained within the normal range of 13%. In a study conducted by Sundaram et al,11 intra–operative fluid management was done in patients undergoing intracranial tumor surgeries with the guidance of CVP and PPV. PPV versus CVP was also compared in another study by Hussein et al.12 in patients schedules for major abdominal operations. They concluded that CVP guided fluid management led to inaccurate fluid replacement. PPV when combined with CVP was a better predictor of fluid requirement instead of a single
| Table 10: Sensitivity, specificity, negative and positive predictive values of CVP | |||
| After PPV | CVP | Total | |
| Abnormal | Normal | ||
| Abnormal | 2 | 2 | 4 |
| Normal | 38 | 18 | 56 |
| Total | 40 | 20 | 60 |
| CVP | Value | 95% CI | |
| Sensitivity | 5.00% | 0.61 to 16.92 | |
| Specificity | 90.0% | 68.30 to 98.77 | |
| Positive predictive value | 50.0% | 13.18 to 86.82 | |
| NPV | 32.14% | 28.71 to 35.78 | |
index. Grassi et al.10 conducted an observational study to evaluate the credibility of Pulse Pressure Variation as a foreteller of fluid responsiveness in mechanically ventilated patients. The conclusion tilted in favor of PPV as a guide for fluid therapy. In our study we used CVP for goal directed therapy and titrated fluids only as per the CVP values. When PPV was correlated with changes in CVP, we observed that PPV values didn’t reflect fluid deficient status by the patients.
Fluid boluses were administered whenever CVP value decreased below 8 cmH2O and at the same time PPV values were noted. The response of the two variable parameters to fluid bolus were recorded. The mean values along with standard deviations were calculated and statistical significance was found out. It was found that the mean CVP values after first fluid bolus was 6.5662 ± 1.8164 cmH2O, after second fluid bolus was 8.4000 ±1.1547 cmH2O and was 8.6471 ± 0.9963 cmH2O after third fluid bolus. Third fluid bolus was required on 17 occasions as per the CVP values. Whenever the mean CVP values showed fluid deficit post three fluid boluses, blood transfusion was considered for the patient. The p value was < 0.001 throughout and demonstrated a statistical significance. In a similar pattern, PPV values were recorded pre and post fluid bolus administration. The mean PPV values with standard deviations after first fluid bolus was 11.8897±1.9802%, after second fluid bolus was 10.00 ± 2.1794% and 9.0588 ± 2.3311% post third fluid bolus which was given on 17 occasions as per CVP values. p value remained < 0.001 throughout this period making it statistically significant. The mean PPV values manifested a fluid– sufficient status at values of CVP which revealed fluid deficit status.
Blood loss was associated with hypotension and decreased CVP and increased PPV values. Mannitol administration increased urine output and affected the MAP and at times the CVP and PPV. The average volume of fluids given to patients was 2575 ± 326.3767 ml. Goal directed fluid therapy on the basis of CVP was administered. None of the patients required vasopressors or inotropes.
The sensitivity of CVP after calculating entirely was 5% and the specificity was 90%. The positive predictive value of CVP was 50% and the negative predictive value was a mere 32.14%. The sensitivity of PPV was 50% and specificity was 32.14%. The positive predictive value was 5% and negative predictive value was 90%.13
The sensitivity of PPV was high compared to CVP, which proves that the probability of PPV measurement identifying an individual with volume deficit is extremely high. Thus, PPV is actually more effective for finding patients which require fluid and guide us while giving fluid bolus. As CVP has higher specificity as compared to PPV, it will not fail to identify patients who do not have fluid deficit. However, an individual CVP value alone will fail to recognize most of the individuals with fluid deficit and thus, is not a good guiding measure to administer fluid bolus. PPV measurements have demonstrated high negative predictive value and thus, it will successfully identify patients who are not in need of a fluid bolus and are adequately hydrated and perfused.
Thus, from the statistics and values of the hemodynamic parameters, PPV may seem to be a better predictor of fluid responsiveness and can be used in goal directed fluid management. However, the sensitivity of PPV is less compared to CVP and thus an allied aid of the static index i.e. CVP will result in better monitoring and management of fluid status of a patient which will eventually lead to hemodynamic stability during intra–operative period of major surgeries. As per our observation, no single parameter can be used independently to assess fluid responsiveness but instead a combination of static and dynamic variables may provide a more suitable option for fluid therapy in neurosurgical patients.
Conclusion
The results of our study conclude that pulse pressure variation is a reliable index of fluid management guidance in neurosurgical patients, while central venous pressure is a poor index which can lead to fluids overload in the patients. Simultaneous monitoring of the both parameters is a better guide for fluid management in neurosurgical patients undergoing craniotomies.
Conflict of Interest
None to declare
Authors’ contribution
PB: Primary author, data collection, manuscript writing
SN: Concept, methodology, editing
HK: Concept, supervision
References
- Zulfiqar Ali, Hemanshu Prabhakar. Fluid Management during neurosurgical procedures. Journal of Neuroanaesthesiology and Critical care 2016.Volume 3, issue 4.
- Mathieu van der Jagt. Fluid management of the neurological patient: a concise review. Critical Care201620:126.
- Navarro LH, Bloomstone JA, Auler JO Jr, Cannesson M, Rocca GD, Gan TJ, Kinsky M, Magder S, Miller TE, Mythen M, Perel A, Reuter DA, Pinsky MR, Kramer GC. Perioperative fluid therapy: a statement from the international Fluid Optimization Group. Perioper Med (Lond). 2015 Apr 10;4:3.
- Abdelazeem Eldawlatly. Has goal directed fluid therapy and glycocalyx a role in enhanced recovery after anaesthesia? Saudi Journal of Anaesthesia 2017; volume 11. Issue 4.
- S Romagnoli, S M Romano, S Bevilacqua, C Lazzeri, F Ciappi, D Dini, C Pratesi, and G F Gensini. Hemodynamic goal-directed therapy. A review. HSR Proc Intensive Care Cardiovasc Anesth. 2009; 1(1): 54–58. AS 5.
- Saraschandra Vallabhajosyula, Jacob C. Jentzer, Kianoush B. Kashani and Sunil V. Mankad. Role of CVP to Guide Fluid Therapy in Chronic Heart Failure: Lessons From Cardiac Intensive Care JACC: Cardiovascular Interventions Volume 9, Issue 6, March 2016.
- Daniel De Backer and Jean- Louis Vincent. Should we measure the central venous pressure to guide fluid management? Ten answers to 10 questions Critical Care. 2018: 22: 43
- Didier Jacques, corresponding author Karim Bendjelid, Serge Duperret, Joëlle Colling, Vincent Piriou, and Jean-Paul Viale. Pulse pressure variation and stroke volume variation during increased intra-abdominal pressure: an experimental study; Crit Care. 2011; 15(1): R33.
- Luiz Marcelo Sá Malbouisson, João Manoel Silva, Jr., Maria José Carvalho Carmona, Marcel Rezende Lopes, Murilo Santucci Assunção, Jorge Luís dos Santos Valiatti, Claudia Marques Simões, and José Otavio Costa Auler, Jr. A pragmatic multi-center trial of goal-directed fluid management based on pulse pressure variation monitoring during high-risk surgery. BMC Anesthesiol. 2017; 17: 70.
- Grassi P, Nigro LL, Battaglia K, Barone M, Testa F, Berl G. Pulse pressure variation as a predictor of fluid responsiveness in mechanically ventilated patients with spontaneous breathing activity: a pragmatic observational study; HSR Proc Intensive Care Cardiovasc Anesth. 2013; 5(2): 98–109.
- Sundaram SC, Salins SR, Kumar AN, Korula G. Intra-Operative Fluid Management in Adult Neurosurgical Patients Undergoing Intracranial Tumour Surgery: Randomised Control Trial Comparing Pulse Pressure Variance (PPV) and Central Venous Pressure (CVP). J Clin Diagn Res. 2016 May;10(5):UC01–UC05.
- Hussein MM, Mostafa RH. Arterial Pulse Pressure Variation versus Central Venous Pressure as a Predictor for Fluid Responsiveness during Open Major Abdominal Operations. O J Anes 2018;8(2).
- Shawkat H, Westwood M, Mortimer A. Mannitol: a review of its clinical uses. Continuing Education in Anaesthesia, Critical Care and Pain. 2012;12(2).