Esmat Barooti1, Bahman Malek2, Safoora Honarmand3, Mohammadreza Moshari2, Seyed Alshohadaei SM4
1Department of Obstetrics & Gynecology, Faculty of Medicine, Shahid Beheshti Medical Sciences University, Tehran, (Iran)
2Anesthesiology Research Center, Shahid Beheshti University of Medical Sciences, Tehran, (Iran)
3Specialist, Department of Obstetrics & Gynecology, Taleghani Hospital, Tehran, (Iran)
4Department of Anesthesiology & Critical Care, Taleghani Hospital, Shahid Beheshti University of Medical Sciences, Tehran, (Iran)
Correspondence: Mohammadreza Moshari
Anesthesiology Dept, Taleghani Hospital, Velenjak, Tehran, (Iran)
E-mail: Rmoshari@sbmu.ac.ir; Phone: +98912 117 2540
Received: 30 May 2018,
Reviewed: 23 August, 26 October 2018, 2 May, 4 May, 16 June, 14 September 2019;
Revised: 14 October 2018, 18 March, 10 June 2019;
Accepted: 14 September 2019
ABSTRACT
Introduction: Postpartum depression (PPD) is a common disorder and a type of clinical depression that affects mothers during the first 4 weeks after childbirth. Considering the destructive effects of this disease on mothers' behavior, identifying the factors affecting PPDand using proper methods in normal delivery is important. The aim of this study was to determine the relationship between regional anesthesia (RA) during labor and the incidence of PPDin women referred to hospitals affiliated to Shahid Beheshti University of Medical Sciences.
Methodology: In this study, 200 pregnant women referred to hospitals of Shahid Beheshti University of Medical Sciences during 2015 to 2017 entered into two equal groups, Group R, administered RA, and Group C; control group without RA according to their desire. Each group consisted of 100 parturients, and the two groups were compared for the incidence of PPD and the association of depression with RA during labor.
Results: Based on the obtained data, the participants in the two groups did not differ significantly in terms of age, body mass index (BMI), duration of delivery phases and depression in the first week of postpartum. However, the severity of pain in different phases of delivery was different due to the use of anesthetic for one of the groups. No significant relationship between RA and depression was observed in the first week after childbirth. However, RA has a significant relationship with PPD in the 4th week, so that the use of RA reduces the incidence of PPD in the 4th week (p = 0.066).
Conclusion: We conclude that the use of regional anesthesia will not have a significant effect on postpartum depression in the first week, but it reduces the incidence of postpartum depression in the 4th week after childbirth.
Key words: Regional anesthesia; Postpartum depression; Pain intensity; Labor; Labor pain
Citation: Barooti E, Malek B, Honarmand S, Moshari M, Alshohadaei SMS. Investigating the association of regional anesthesia during labor with postpartum depression. Anaesth pain & intensive care 2019;23(3):353-359.
DOI: https://doi.org/10.35975/apic.v23i4.1167
INTRODUCTION
Postpartum depression (PPD) is a common disorder among pregnant women and may indicate signs of depression (feeling lonely, anxious, confused and lack of drive) in mothers during the 1st to 4th weeks after delivery. The disease is more common in women especially those who first got pregnant. A meta-analysis in 1996 showed that 10-15% of mothers experienced this condition during the first 12 months of their baby's birth.1,2 Other studies have shown that the incidence of illness is higher among young women and mothers who have a history of stress or sexual abuse.3,4 Another study showed that the prevalence of depressive symptoms reported by mothers after delivery was about 12% to 20.5%.5,6 The cause of the disease is not well-known, and various studies have shown that many factors can affect its occurrence. Studies have shown that the process of delivery is likely to affect the incidence and severity of this depression.7-10 These studies have pointed out that one of the major factors influencing the likelihood of the onset and severity of depression is the amount of pain the mother experiences during childbirth. In Iran, limited and limited studies have been conducted to examine the relationship between the process of delivery and regional anesthesia (RA) with depression afterwards.11 Foreign studies have also studied the effects of variables such as stress, prenatal mental disorder, first pregnancy and marital problems on PPD, but few studies have been done on the relationship between RA and PPD. Therefore, in this study, the use of RA during labor as a possible variable affecting PPD in women referred to educational hospitals of Shahid Beheshti University of Medical Sciences during 2015 to 2017 was investigated.
METHODOLOGY
This study was a prospective cohort study which included 200 parturients of Noolipar Singh, candidates for vaginal delivery referred to educational hospitals of Shahid Beheshti University of Medical Sciences during the years 2015-2017. The study process for mothers was described at the time of admission in the labor room, and patients with their desire to enter each of the two groups; Group R - with RA or Group C - without RA. From all patients written consent was obtained to participate in the study. Exclusion criteria included cesarean delivery, multi-parity, history of previous depression, mood impairment and having neurological problems such as epilepsy, history of smoking, anomalies of an embryo, death of the infant and stillbirth. The demographic data, gestational age, maternal age, history of diseases and drug use, smoking or alcohol were asked and entered in a special questionnaire. Also, information on the duration of each phase of delivery, total delivery time, pain scores (pain intensity) in each phase based on VAS (0 = painless to 10 = the worst and most severe pain experience) was also asked and recorded. This scoring was noted in Group C when cervix ≥ 3 cm and in Group R 10 to 30 min after RA. Anesthesia is performed in the active phase of labor (dilatation 3 to 5 cm). After 7 days and 4 weeks PPD, based on the Edinburgh Postnatal Depression Scale (EPDS), a 10-item questionnaire, and its results were recorded in a special questionnaire for each mother. Then the data was entered into SPSS software version 21 and analyzed. The continuous data was reported as the sum of mean and standard deviation (Mean ± Standard Deviation) and the discrete data were reported as frequency (number or percent). In order to compare the results before and after the treatment, Paired test was used and the two groups were compared by Independent T Test. For groups quantitative comparison of chi-square method was used and the relationship between variables was investigated with regression tests and Pearson correlation method. In this study, the significance level of α was considered to be less than 0.05.
RESULTS
Demographic characteristics of the data
A summary of the information provided by this study regarding the presence of patients in anesthetized and non-anesthetized groups is presented in Table 1. As can be seen in this table, the severity of pain decreased significantly after applying RA and decreased from 9.08 in the first phase of labor to 1.14 in the second phase of labor. Therefore, it is clear that the use of RA will reduce the pain of the patient and this index has a significant difference in the two groups.
The results for the other variables are presented in Table 2.
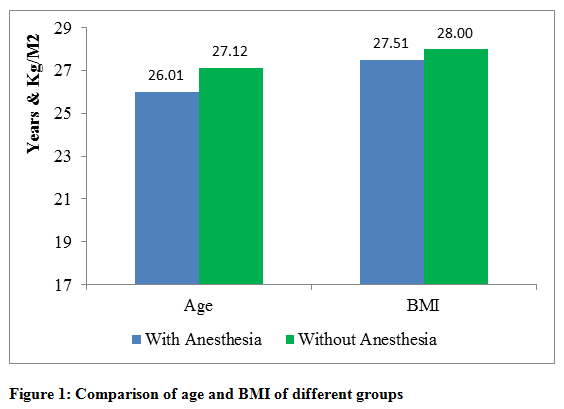
Table 3 shows that the members of the two groups in terms of age, body mass index (BMI), duration of first, second and third phases of labor, the degree of depression in the 1st week, the degree of depression in the 4th week and the severity of pain in the 1st phase of labor before RA at 95% confidence level, there is no significant difference. However, the severity of the 1st phase pain after anesthesia, as well as the severity of pain in the 2nd and 3rd phases, were significantly different between the two groups. Since RA has a dramatic effect on pain relief, it is natural that after anesthesia, the severity of the pain will be different between the two groups.
The identical variables of age, BMI and duration of delivery phases indicate that the members of the two groups are randomly selected and the research findings can be cited. However, the variable depression in the 4th postnatal week should be examined more precisely on Edinburgh Postnatal Depression Scale (EPDS-28). The t-test in the averaging test for the two groups for the EPDS-28 variable is 847/1, which is close to 1.96, and a significant level or p-value of 0.66 is obtained. In fact, the assumption of zero on the equality of the two groups' meanings in the EPDS-28 variable (depression in the 4th week after delivery) can be rejected at a significant level of 93% and lower. Therefore, in case of a 95% significance level as a standard, it can be concluded that there is a significant difference between the severity of depression in the 4th week in both groups.
Correlation between research variables:
To investigate the relationship between different variables with depression level in the 1st and 4th weeks after delivery, Pearson correlation coefficient can be used. First, the Group C (with normal delivery without epidural use) has been investigated and the results are presented in Table 3.
Table 3 contains several data. According to this table, all variables have a positive and significant correlation with depression in the 4th week after delivery. Positive correlation coefficients indicate the direct relationship between different variables; and the size of the correlation coefficient indicates the severity of the effect of these variables on each other. Since the values of the correlation coefficient are always less than 0.3, it can be concluded that there is a weak correlation between different variables and depression in the 4th week after delivery. On the other hand, the positive coefficients indicate that increasing age, increasing BMI, and increasing the severity of pain cause an increase in the incidence of PPD in the 4th week. Interestingly, age and BMI has a significant and positive effect on the amount of depression in the first week after childbirth. For this reason, it can be concluded that in the absence of RA, the increase in age and BMI will increase the rate of depression in the first week (also the 4th week) after delivery. The relationship between age and BMI variables with depression was based on Table 4 in the Group C. There is a positive, significant and weak correlation between these variables. Pearson correlation coefficients and confidence levels related to the anesthetic group are presented in Table 4. Unlike the group without anesthesia, the use of anesthesia method for normal delivery causes no significant correlation between age, BMI and severity of first and third phase of delivery with depression in the first and 4th weeks after delivery.
The severity of pain in the first phases (after anesthesia) and the second birth have a positive, significant and poor correlation with severity in the first and 4th weeks after delivery. It should be noted that the Pearson correlation coefficient in Table 5 is always less than 0.267 and the relationship between the various variables is poor. The aggregation of the results obtained from the study of different groups indicates that the intensity of the second phase has a positive and meaningful relationship with depression after the 4th week of labor. However, there is no decisive result in the correlation of other variables and therefore the total sample members in Table 5 have been examined for their correlation and meaningfulness.
The results of Table 5 show that there is a positive and significant correlation between BMI and PPD, but this relationship is very weak and Pearson correlation coefficient is between 157/0 and 167/0. On the other hand, the severity of pain in the second and third phases of delivery has no significant correlation with depression in the first week after delivery, but again there is a weak, positive and significant relationship between these variables and depression in the 4th week after delivery. Using the mean pain intensity (VAS) and examining the correlation of this variable with depression will allow for a more accurate conclusion (Table 6). Table 7 shows that the severity of pain with depression was not correlated in the first week after delivery, but with depression in the 4th week after delivery has a weak and positive relationship. Pearson correlation coefficient between mean pain severity (VAS) and depression in the 4th week postpartum is 0.2 and this coefficient is even significant at 99% confidence level. There is no significant correlation between age and PPD, the positive correlation between BMI and depression in both periods and also a significant positive correlation between mean pain severity and depression in the 4th week after childbirth are among the findings of this section of the study.
Review the main hypothesis:
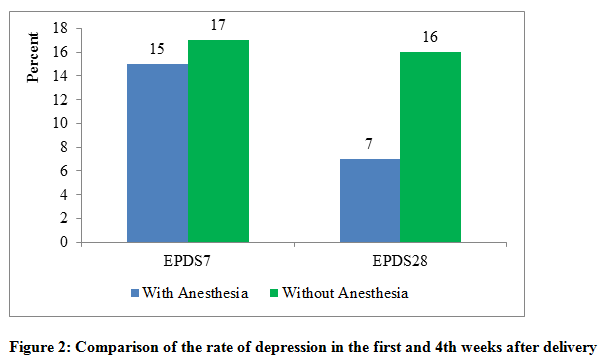
Table 2 showed that there was a significant difference in the level of depression in the 4th week after delivery between the anesthesia groups and without anesthesia at 95% confidence level and there was no significant difference in the 95% confidence level. Table 7 shows the number of people with PPD in the two groups and it is observed that 17 and 16% of the members of the group had symptoms of depression without anesthesia in the first and 4th weeks after delivery. On the other hand, 15% and 7% mothers in Group R were depressed in 1st and 4th week pp respectively. Although, there is no significant difference between the number of people with depression in the first week between the two groups, but the comparison of the numbers of 16 and 7%, given the similarity of the number of members of the groups, indicates that the rate of depression in the 4th week postpartum among the anesthesia groups and without anesthesia there is a difference.
Comparison of Figures 1 and 2 shows that there is a significant difference between the number of mothers with PPD in the 4th week in two groups. Therefore, at 90% confidence level, it can be concluded that the use of RA will have a significant effect on reducing the rate of depression in the 4th week after delivery, but this effect is poor and the exact conclusion about it will be related to an increase in the number of samples. Figure 1 shows that there is no significant difference between age and body mass in the two groups and statistical studies have confirmed that there is no significant difference between the two groups. But in Figure 2, which is based on the data in Table 8, it is observed that the anesthesia group has significantly a lower frequency of depression in both 1st week and 4th weeks postpartum (p = 0.066).
DISCUSSION
This research was conducted to investigate the relationship between RA during labor and the probability of PPD. Essential information, e.g. maternal age, BMI, duration of delivery phases, pain intensity in different phases, and PPD were collected as variables. The results indicate that the mother's age does not have a significant relationship with the rate of PPD, but BMI has a positive correlation with the rate of depression in both the intervals of one week and four weeks after delivery. On the other hand, the use of RA does not have a significant effect on the rate of depression in one week after delivery. But there is a meaningful and weak relationship between RA and depression in the four weeks postpartum. Based on data from this study, 17% of mothers who experienced normal and non-anesthetic delivery experienced depression in the first week after delivery and 16% of mothers showed depression symptoms in the 4th week postpartum. Of the mothers who chose a RA, 15% of the postpartum week had depression and only 7% of them had symptoms of depression in the 4th week after delivery. The mean parity tests of two groups and Pearson correlation coefficients indicate that there is no meaningful relation between short-term depression after regional delivery and RA.6-8 But the likelihood of a 4-week PPD with RA has a negative correlation. We observed that RA has no negative effect on PPD and there is a significant relationship between long-term (four weeks postpartum) anesthesia and reduced depression.7-10 In order to obtain more accurate results, it is suggested that prospective studies be conducted to measure depression. External studies have shown that increasing the interval between deliveries can reduce the effect of RA and there is no significant relationship between anesthesia and depression in the long run.7-10 In addition, cross-sectional regression can be used to accurately determine how effect of variables on each other. Using independent variables and controls in a cross-sectional regression, the effect of RA on depression is quantitatively determined and the effect of variables such as age and BMI can be more accurately calculated. As about 15% of patients in the study suffered PPD, an increase in the number of sample size should also be considered as the most effective way to increase the accuracy of the results. In this study, 16 patients without anesthesia and 7 patients in the anesthesia group suffered from depression in the four months postpartum period and is clear that small numbers such as 16 and 7 are not statistically comparable and cannot be conclusively compared.
CONCLUSION
Based upon the results of our study, we conclude that the use of regional anesthesia does not have a significant effect on the frequency of postpartum depression in the first week, but it does reduce its frequency in the 4th week after childbirth significantly. We recommend prospective, multi-center studies with larger sample sizes to accurately document the effect in different postnatal time frames.
Conflict of interest: None of the author has declared any conflict of interest and no external funding was involved in the study.
Authors’ contributions:
EB: Concept, conduction of the study work and manuscript editing
BM: Perform sample analysis process
SH: Planning and participation in the implementation of the process.
MM: Responsible for conducting research
SASM: participation in the implementation of the process
REFERENCES
Table 2: Differences of study variables in two groups
Table 3: Correlation between different variables and PPD without anesthesia
Table 4: Correlation between different variables and PPD with anesthesia
Table 5: Correlation between different variables and PPD of total sample members
Table 6: Correlation between severity of pain and PPD
Table 7: Comparison of PPD in different groups
1Department of Obstetrics & Gynecology, Faculty of Medicine, Shahid Beheshti Medical Sciences University, Tehran, (Iran)
2Anesthesiology Research Center, Shahid Beheshti University of Medical Sciences, Tehran, (Iran)
3Specialist, Department of Obstetrics & Gynecology, Taleghani Hospital, Tehran, (Iran)
4Department of Anesthesiology & Critical Care, Taleghani Hospital, Shahid Beheshti University of Medical Sciences, Tehran, (Iran)
Correspondence: Mohammadreza Moshari
Anesthesiology Dept, Taleghani Hospital, Velenjak, Tehran, (Iran)
E-mail: Rmoshari@sbmu.ac.ir; Phone: +98912 117 2540
Received: 30 May 2018,
Reviewed: 23 August, 26 October 2018, 2 May, 4 May, 16 June, 14 September 2019;
Revised: 14 October 2018, 18 March, 10 June 2019;
Accepted: 14 September 2019
ABSTRACT
Introduction: Postpartum depression (PPD) is a common disorder and a type of clinical depression that affects mothers during the first 4 weeks after childbirth. Considering the destructive effects of this disease on mothers' behavior, identifying the factors affecting PPDand using proper methods in normal delivery is important. The aim of this study was to determine the relationship between regional anesthesia (RA) during labor and the incidence of PPDin women referred to hospitals affiliated to Shahid Beheshti University of Medical Sciences.
Methodology: In this study, 200 pregnant women referred to hospitals of Shahid Beheshti University of Medical Sciences during 2015 to 2017 entered into two equal groups, Group R, administered RA, and Group C; control group without RA according to their desire. Each group consisted of 100 parturients, and the two groups were compared for the incidence of PPD and the association of depression with RA during labor.
Results: Based on the obtained data, the participants in the two groups did not differ significantly in terms of age, body mass index (BMI), duration of delivery phases and depression in the first week of postpartum. However, the severity of pain in different phases of delivery was different due to the use of anesthetic for one of the groups. No significant relationship between RA and depression was observed in the first week after childbirth. However, RA has a significant relationship with PPD in the 4th week, so that the use of RA reduces the incidence of PPD in the 4th week (p = 0.066).
Conclusion: We conclude that the use of regional anesthesia will not have a significant effect on postpartum depression in the first week, but it reduces the incidence of postpartum depression in the 4th week after childbirth.
Key words: Regional anesthesia; Postpartum depression; Pain intensity; Labor; Labor pain
Citation: Barooti E, Malek B, Honarmand S, Moshari M, Alshohadaei SMS. Investigating the association of regional anesthesia during labor with postpartum depression. Anaesth pain & intensive care 2019;23(3):353-359.
DOI: https://doi.org/10.35975/apic.v23i4.1167
INTRODUCTION
Postpartum depression (PPD) is a common disorder among pregnant women and may indicate signs of depression (feeling lonely, anxious, confused and lack of drive) in mothers during the 1st to 4th weeks after delivery. The disease is more common in women especially those who first got pregnant. A meta-analysis in 1996 showed that 10-15% of mothers experienced this condition during the first 12 months of their baby's birth.1,2 Other studies have shown that the incidence of illness is higher among young women and mothers who have a history of stress or sexual abuse.3,4 Another study showed that the prevalence of depressive symptoms reported by mothers after delivery was about 12% to 20.5%.5,6 The cause of the disease is not well-known, and various studies have shown that many factors can affect its occurrence. Studies have shown that the process of delivery is likely to affect the incidence and severity of this depression.7-10 These studies have pointed out that one of the major factors influencing the likelihood of the onset and severity of depression is the amount of pain the mother experiences during childbirth. In Iran, limited and limited studies have been conducted to examine the relationship between the process of delivery and regional anesthesia (RA) with depression afterwards.11 Foreign studies have also studied the effects of variables such as stress, prenatal mental disorder, first pregnancy and marital problems on PPD, but few studies have been done on the relationship between RA and PPD. Therefore, in this study, the use of RA during labor as a possible variable affecting PPD in women referred to educational hospitals of Shahid Beheshti University of Medical Sciences during 2015 to 2017 was investigated.
METHODOLOGY
This study was a prospective cohort study which included 200 parturients of Noolipar Singh, candidates for vaginal delivery referred to educational hospitals of Shahid Beheshti University of Medical Sciences during the years 2015-2017. The study process for mothers was described at the time of admission in the labor room, and patients with their desire to enter each of the two groups; Group R - with RA or Group C - without RA. From all patients written consent was obtained to participate in the study. Exclusion criteria included cesarean delivery, multi-parity, history of previous depression, mood impairment and having neurological problems such as epilepsy, history of smoking, anomalies of an embryo, death of the infant and stillbirth. The demographic data, gestational age, maternal age, history of diseases and drug use, smoking or alcohol were asked and entered in a special questionnaire. Also, information on the duration of each phase of delivery, total delivery time, pain scores (pain intensity) in each phase based on VAS (0 = painless to 10 = the worst and most severe pain experience) was also asked and recorded. This scoring was noted in Group C when cervix ≥ 3 cm and in Group R 10 to 30 min after RA. Anesthesia is performed in the active phase of labor (dilatation 3 to 5 cm). After 7 days and 4 weeks PPD, based on the Edinburgh Postnatal Depression Scale (EPDS), a 10-item questionnaire, and its results were recorded in a special questionnaire for each mother. Then the data was entered into SPSS software version 21 and analyzed. The continuous data was reported as the sum of mean and standard deviation (Mean ± Standard Deviation) and the discrete data were reported as frequency (number or percent). In order to compare the results before and after the treatment, Paired test was used and the two groups were compared by Independent T Test. For groups quantitative comparison of chi-square method was used and the relationship between variables was investigated with regression tests and Pearson correlation method. In this study, the significance level of α was considered to be less than 0.05.
RESULTS
Demographic characteristics of the data
A summary of the information provided by this study regarding the presence of patients in anesthetized and non-anesthetized groups is presented in Table 1. As can be seen in this table, the severity of pain decreased significantly after applying RA and decreased from 9.08 in the first phase of labor to 1.14 in the second phase of labor. Therefore, it is clear that the use of RA will reduce the pain of the patient and this index has a significant difference in the two groups.
The results for the other variables are presented in Table 2.
Table 3 shows that the members of the two groups in terms of age, body mass index (BMI), duration of first, second and third phases of labor, the degree of depression in the 1st week, the degree of depression in the 4th week and the severity of pain in the 1st phase of labor before RA at 95% confidence level, there is no significant difference. However, the severity of the 1st phase pain after anesthesia, as well as the severity of pain in the 2nd and 3rd phases, were significantly different between the two groups. Since RA has a dramatic effect on pain relief, it is natural that after anesthesia, the severity of the pain will be different between the two groups.
The identical variables of age, BMI and duration of delivery phases indicate that the members of the two groups are randomly selected and the research findings can be cited. However, the variable depression in the 4th postnatal week should be examined more precisely on Edinburgh Postnatal Depression Scale (EPDS-28). The t-test in the averaging test for the two groups for the EPDS-28 variable is 847/1, which is close to 1.96, and a significant level or p-value of 0.66 is obtained. In fact, the assumption of zero on the equality of the two groups' meanings in the EPDS-28 variable (depression in the 4th week after delivery) can be rejected at a significant level of 93% and lower. Therefore, in case of a 95% significance level as a standard, it can be concluded that there is a significant difference between the severity of depression in the 4th week in both groups.
Correlation between research variables:
To investigate the relationship between different variables with depression level in the 1st and 4th weeks after delivery, Pearson correlation coefficient can be used. First, the Group C (with normal delivery without epidural use) has been investigated and the results are presented in Table 3.
Table 3 contains several data. According to this table, all variables have a positive and significant correlation with depression in the 4th week after delivery. Positive correlation coefficients indicate the direct relationship between different variables; and the size of the correlation coefficient indicates the severity of the effect of these variables on each other. Since the values of the correlation coefficient are always less than 0.3, it can be concluded that there is a weak correlation between different variables and depression in the 4th week after delivery. On the other hand, the positive coefficients indicate that increasing age, increasing BMI, and increasing the severity of pain cause an increase in the incidence of PPD in the 4th week. Interestingly, age and BMI has a significant and positive effect on the amount of depression in the first week after childbirth. For this reason, it can be concluded that in the absence of RA, the increase in age and BMI will increase the rate of depression in the first week (also the 4th week) after delivery. The relationship between age and BMI variables with depression was based on Table 4 in the Group C. There is a positive, significant and weak correlation between these variables. Pearson correlation coefficients and confidence levels related to the anesthetic group are presented in Table 4. Unlike the group without anesthesia, the use of anesthesia method for normal delivery causes no significant correlation between age, BMI and severity of first and third phase of delivery with depression in the first and 4th weeks after delivery.
The severity of pain in the first phases (after anesthesia) and the second birth have a positive, significant and poor correlation with severity in the first and 4th weeks after delivery. It should be noted that the Pearson correlation coefficient in Table 5 is always less than 0.267 and the relationship between the various variables is poor. The aggregation of the results obtained from the study of different groups indicates that the intensity of the second phase has a positive and meaningful relationship with depression after the 4th week of labor. However, there is no decisive result in the correlation of other variables and therefore the total sample members in Table 5 have been examined for their correlation and meaningfulness.
The results of Table 5 show that there is a positive and significant correlation between BMI and PPD, but this relationship is very weak and Pearson correlation coefficient is between 157/0 and 167/0. On the other hand, the severity of pain in the second and third phases of delivery has no significant correlation with depression in the first week after delivery, but again there is a weak, positive and significant relationship between these variables and depression in the 4th week after delivery. Using the mean pain intensity (VAS) and examining the correlation of this variable with depression will allow for a more accurate conclusion (Table 6). Table 7 shows that the severity of pain with depression was not correlated in the first week after delivery, but with depression in the 4th week after delivery has a weak and positive relationship. Pearson correlation coefficient between mean pain severity (VAS) and depression in the 4th week postpartum is 0.2 and this coefficient is even significant at 99% confidence level. There is no significant correlation between age and PPD, the positive correlation between BMI and depression in both periods and also a significant positive correlation between mean pain severity and depression in the 4th week after childbirth are among the findings of this section of the study.
Review the main hypothesis:
Table 2 showed that there was a significant difference in the level of depression in the 4th week after delivery between the anesthesia groups and without anesthesia at 95% confidence level and there was no significant difference in the 95% confidence level. Table 7 shows the number of people with PPD in the two groups and it is observed that 17 and 16% of the members of the group had symptoms of depression without anesthesia in the first and 4th weeks after delivery. On the other hand, 15% and 7% mothers in Group R were depressed in 1st and 4th week pp respectively. Although, there is no significant difference between the number of people with depression in the first week between the two groups, but the comparison of the numbers of 16 and 7%, given the similarity of the number of members of the groups, indicates that the rate of depression in the 4th week postpartum among the anesthesia groups and without anesthesia there is a difference.
Comparison of Figures 1 and 2 shows that there is a significant difference between the number of mothers with PPD in the 4th week in two groups. Therefore, at 90% confidence level, it can be concluded that the use of RA will have a significant effect on reducing the rate of depression in the 4th week after delivery, but this effect is poor and the exact conclusion about it will be related to an increase in the number of samples. Figure 1 shows that there is no significant difference between age and body mass in the two groups and statistical studies have confirmed that there is no significant difference between the two groups. But in Figure 2, which is based on the data in Table 8, it is observed that the anesthesia group has significantly a lower frequency of depression in both 1st week and 4th weeks postpartum (p = 0.066).
DISCUSSION
This research was conducted to investigate the relationship between RA during labor and the probability of PPD. Essential information, e.g. maternal age, BMI, duration of delivery phases, pain intensity in different phases, and PPD were collected as variables. The results indicate that the mother's age does not have a significant relationship with the rate of PPD, but BMI has a positive correlation with the rate of depression in both the intervals of one week and four weeks after delivery. On the other hand, the use of RA does not have a significant effect on the rate of depression in one week after delivery. But there is a meaningful and weak relationship between RA and depression in the four weeks postpartum. Based on data from this study, 17% of mothers who experienced normal and non-anesthetic delivery experienced depression in the first week after delivery and 16% of mothers showed depression symptoms in the 4th week postpartum. Of the mothers who chose a RA, 15% of the postpartum week had depression and only 7% of them had symptoms of depression in the 4th week after delivery. The mean parity tests of two groups and Pearson correlation coefficients indicate that there is no meaningful relation between short-term depression after regional delivery and RA.6-8 But the likelihood of a 4-week PPD with RA has a negative correlation. We observed that RA has no negative effect on PPD and there is a significant relationship between long-term (four weeks postpartum) anesthesia and reduced depression.7-10 In order to obtain more accurate results, it is suggested that prospective studies be conducted to measure depression. External studies have shown that increasing the interval between deliveries can reduce the effect of RA and there is no significant relationship between anesthesia and depression in the long run.7-10 In addition, cross-sectional regression can be used to accurately determine how effect of variables on each other. Using independent variables and controls in a cross-sectional regression, the effect of RA on depression is quantitatively determined and the effect of variables such as age and BMI can be more accurately calculated. As about 15% of patients in the study suffered PPD, an increase in the number of sample size should also be considered as the most effective way to increase the accuracy of the results. In this study, 16 patients without anesthesia and 7 patients in the anesthesia group suffered from depression in the four months postpartum period and is clear that small numbers such as 16 and 7 are not statistically comparable and cannot be conclusively compared.
CONCLUSION
Based upon the results of our study, we conclude that the use of regional anesthesia does not have a significant effect on the frequency of postpartum depression in the first week, but it does reduce its frequency in the 4th week after childbirth significantly. We recommend prospective, multi-center studies with larger sample sizes to accurately document the effect in different postnatal time frames.
Conflict of interest: None of the author has declared any conflict of interest and no external funding was involved in the study.
Authors’ contributions:
EB: Concept, conduction of the study work and manuscript editing
BM: Perform sample analysis process
SH: Planning and participation in the implementation of the process.
MM: Responsible for conducting research
SASM: participation in the implementation of the process
REFERENCES
- American Psychiatric Association. Diagnostic and Statistical Manual of Mental Disorders. 4th ed. Washington DC: American Psychiatric Press, 2000.
- Boudou M, Teissedre F, Walburg V, Chabrol H. Association between the intensity of childbirth pain and the intensity of postpartum blues. Encephale. 2007;33:805-10. [PubMed] DOI: 1016/j.encep.2006.10.002
- Center for Disease Control and Prevention. Prevalence of self-reported postpartum depressive symptoms-17 states, 2004-2005. MMWR Morb Mortal Wkly Rep. 2008;57(14):361-6. [PubMed] [Free Full Text]
- Ding T, Wang DX,Qu Y, Chen Q, Zhu SN. Epidural labor analgesia is associated with a decreased risk of postpartum depression: a prospective cohort study. Anesth Analg. 2014 Aug;119(2):383-92. [PubMed] DOI: 1213/ANE.0000000000000107
- Eisenach JC, Pan PH, Smiley R, Lavand'homme P, Landau R, Houle TT. Severity of acute pain after childbirth, but not type of delivery, predicts persistent pain and postpartum depression. Pain. 2008;140(1):87-94. [PubMed] DOI: 1016/j.pain.2008.07.011
- Gross KH, Wells CS, Radigan-Garcia A, Dietz PM. Correlates of self-reports of being very depressed in the months after delivery: results from the Pregnancy Risk Assessment Monitoring System. Matern Child Health J. 2002;6(4):247-53. [PubMed] DOI: 1023/a:1021110100339
- Hiltunen P, Raudaskoski T, Ebeling H, Moilanen I. Does pain relief during delivery decrease the risk of postnatal depression? Acta Obstet Gynecol Scand. 2004 Mar 1;83(3):257-61. [PubMed] DOI: 1111/j.0001-6349.2004.0302.x
- Melzack R, Katz J. Pain management in persons in pain. In: Wall PD, Melzack R, (eds). Textbook of Pain. Edinburgh: Churchill Livingstone; 1999.
- O'Hara MW, Swain AM. Rates and risk of postpartum depression-a meta-analysis. Int Rev Psychiatry. 1996;8:37-54.
- Schmidt RM, Wiemann CM, Rickert VI, Smith EO. Moderate to severe depressive symptoms among adolescent mothers followed four years postpartum. J Adolesc Health. 2006;38:712-8. [PubMed] DOI: 1016/j.jadohealth.2005.05.023
- World Health Organization. International Statistical Classification of Diseases and Related Health Problems, Tenth Revision (ICD-10). Herndon, VA: Stylus Publishing, Llc,; 2007.
Table 1: Summary of features of study variables
| Variable name | Unit of measurement | Group C | Group R |
| Age | Years | 25/5 12/27 | 11/5 01/26 |
| BMI | Kg/m2 | 64/4 99/27 | 42/4 50/27 |
| Duration of the first delivery phase (F1) | Time | 68/3 04/11 | 13/3 30/11 |
| Duration of the second delivery phase (F2) | Time | 77/17 10/42 | 84/21 00/45 |
| The term of the third delivery phase (F3) | Min | 20/3 15/7 | 44/3 40/7 |
| The intensity of the first phase pain (VAS1) | 0-10 | 98/0 26/9 | 37/1 08/9 |
| Severity of pain after anesthesia (VAS1B) | 0-10 | 98/0 26/9 | 90/1 15/1 |
| The intensity of the second phase pain (VAS2) | 0-10 | 93/0 45/9 | 90/1 14/1 |
| Severity of pain in the third phase (VAS3) | 0-10 | 38/0 17/0 | 22/0 05/0 |
| Average pain intensity of all three phases (VAS) | 0-10 | 71/0 29/6 | 34/1 85/2 |
| Depression in the first week (EPDS7) | 0-20 | 99/1 86/9 | 24/2 89/9 |
| Depression in the 4th week (EPDS28) | 0-20 | 37/2 78/9 | 14/2 19/9 |
| Variable name | p-value | t | Reject or not reject | Result |
| Age | 0.131. | 515/1 | H0 | No difference |
| BMI | 446.0 | 763/0 | H0 | No difference |
| Duration of the first delivery phase (F1) | 589/0 | 541/0 - | H0 | No difference |
| Duration of the second delivery phase (F2) | 304/0 | 030/1 - | H0 | No difference |
| The term of the third delivery phase (F3) | 595/0 | 532/0 - | H0 | No difference |
| Intensity of the first phase pain (VAS1) | 286/0 | 069/1 | H0 | No difference |
| Severity of pain after anesthesia (VAS1B) | 000./0 | 955/37 | H1 | Difference |
| Intensity of the second phase pain (VAS2) | 000/0 | 293/39 | H1 | Difference |
| Severity of pain in the third phase (VAS3) | 007/0 | 749/2 | H1 | Difference |
| Depression in the first week (EPDS7) | 920/0 | 100/0 - | H0 | No difference |
| Depression in the 4th week (EPDS28) | 066/0 | 847/1 | H0 | No difference |
| Variable | Description | EPDS-7 | EPDS-28 |
| Age | Correlation coefficient | 251/0 | 211/0 |
| The significance level | 012/0 | 035/0 | |
| BMI | Correlation coefficient | 208/0 | 209/0 |
| The significance level | 038/0 | 037/0 | |
| The intensity of the first phase pain (VAS1) | Correlation coefficient | 133/0 | 229/0 |
| The significance level | 188/0 | 022/0 | |
| The intensity of the second phase pain (VAS2) | Correlation coefficient | 166/0 | 253/0 |
| The significance level | 098/0 | 011/0 | |
| Severity of pain in the third phase (VAS3) | Correlation coefficient | 153/0 | 200/0 |
| The significance level | 129/0 | 046/0 |
| Variable | Description | EPDS-7 | EPDS-28 |
| Age | Correlation coefficient | 080/0 - | 100/0 - |
| The significance level | 427/0 | 323/0 | |
| BMI | Correlation coefficient | 131/0 | 084/0 |
| The significance level | 194/0 | 405/0 | |
| Intensity of the 1st phase pain (VAS1) | Correlation coefficient | 136/0 - | 160/0 - |
| The significance level | 178/0 | 111/0 | |
| Intensity of the 2nd phase pain (VAS2) | Correlation coefficient | 267/0 | 204/0 |
| The significance level | 007/0 | 041/0 | |
| Severity of pain in the 3rd phase (VAS3) | Correlation coefficient | 073/0 | 020/0 - |
| The significance level | 469/0 | 840/0 | |
| Severity of pain after anesthesia (VAS1B) | Correlation coefficient | 265/0 | 204/0 |
| The significance level | 008/0 | 042/0 |
| Variable | Description | EPDS-7 | EPDS-28 |
| Age | Correlation coefficient | 077/0 | 079/0 |
| The significance level | 282/0 | 267/0 | |
| BMI | Correlation coefficient | 167/0 | 157/0 |
| The significance level | 018/0 | 027/0 | |
| The intensity of the first phase pain (VAS1) | Correlation coefficient | 031/0 - | 021/0 |
| The significance level | 658/0 | 764/0 | |
| The intensity of the second phase pain (VAS2) | Correlation coefficient | 070/0 | 191/0 |
| The significance level | 324/0 | 007/0 | |
| Severity of pain in the third phase (VAS3) | Correlation coefficient | 112/0 | 143/0 |
| The significance level | 115/0 | 043/0 | |
| Severity of pain after anesthesia (VAS1B) | Correlation coefficient | 069/0 | 191/0 |
| The significance level | 334/0 | 007/0 |
| Variable | Description | EPDS7 | EPDS28 |
| Mean pain intensity (VAS) | Correlation coefficient | 080/0 | 200/0 |
| The significance level | 262/0 | 005/0 |
| Variable | Group C | Group R |
| Depression in the first week (EPDS-7) | 17% | 15% |
| Depression in the 4th Week (EPDS-28) | 16% | 7% |